North Dakota oil production up 5% in June 2014

Bakken IMG_0652 8-15

(Photo by James Ulvog)

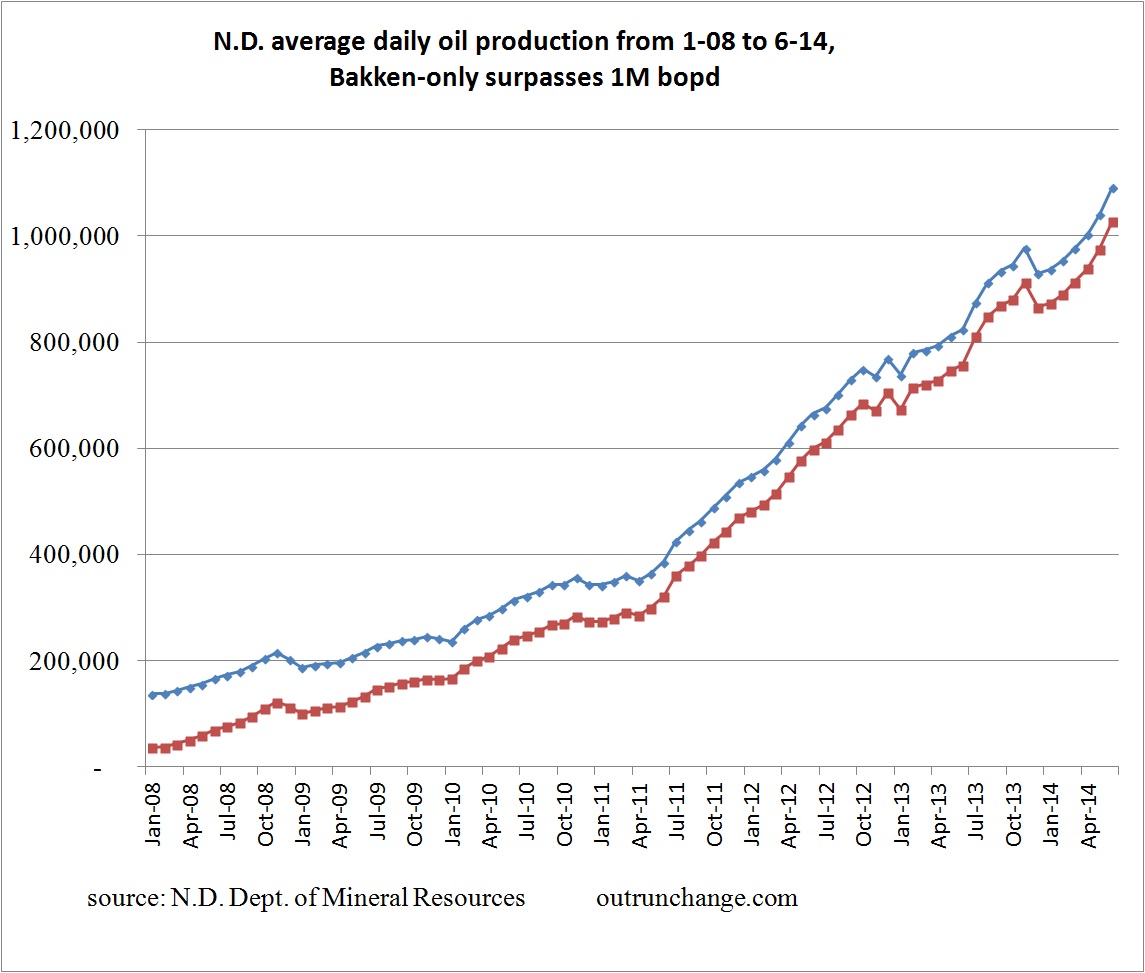
Production in the state hit an average of 1,092,617 barrels per day (bopd) in June 2014, up from a revised 1,040,469 in May. That’s an increase of 5.01%. Since December, that would be an 18.7% increase. Not bad for six months.

Even better, Bakken-only production passed the one million point – 1,028,352 bopd.

Here are two graphs showing the production trend.

Production by month since 2008, showing total for the state and Bakken-only:

ND production june 14

Total production by month since 1990:

Continue reading “North Dakota oil production up 5% in June 2014”

More good stuff on the Bakken – 8/11

Here’s a few quick notes on interesting news that I won’t cover in a separate post:

7/25 – PR Newswire – More than 30% Growth in Shale Oil Output in Bakken, Eagle Ford: Platts’ Bentek Energy – In June ’14, increase of prior year June production was 28.9% in Bakken and 37.6% in Eagle Ford. Compared to where I was four years ago, if I saw that report fresh today, I would write a full length post on that one article. Today, that is old news for me.

Internal rate of return is above 50% in Bakken and 65% in Eagle Ford. The article explains what that means: Continue reading “More good stuff on the Bakken – 8/11”

What Peak Oil? – #35

Update:  Some commenters on the ‘net did not agree with a graph that combines gas and oil. Fair point. I’ll redraw the graph to include only crude oil.

The new graph does not change any comment made in this post. It stands as is.

Peak oil is still a failed concept.

Here is the new graph:
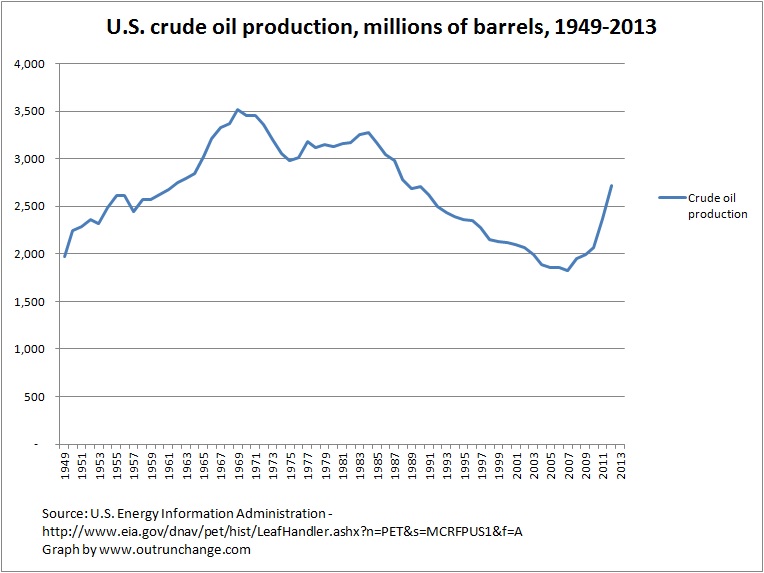
barrels by year 1949-2013


Again, here is the main question: Where is the inverted V drop after the peak that mirrors the runup to the high point?

Answer: It isn’t there.

2nd Update:  I appreciate folks pointing out the error of my ways. Further research produced the above graph which makes the point yet again. I also looked at natural gas production.

The fail of Dr. Hubbert’s theories is even more extremely illustrated by graphing natural gas production. Comparing actual to his predictions is staggering. Another post on Monday.

Two busted Hubbert theories from one post. Peak Gas is even more of a fail than Peak Oil.

3rd update:  Further discussion of the Peak Oil graph on the following post.

Original post:

Saw a graph containing production of oil and gas in the U.S. since 1950. Since that one is copyrighted, decided to make my own.

Check out this graph of the amount of crude oil, natural gas (dry), and NGPL from 1949 through 2013:
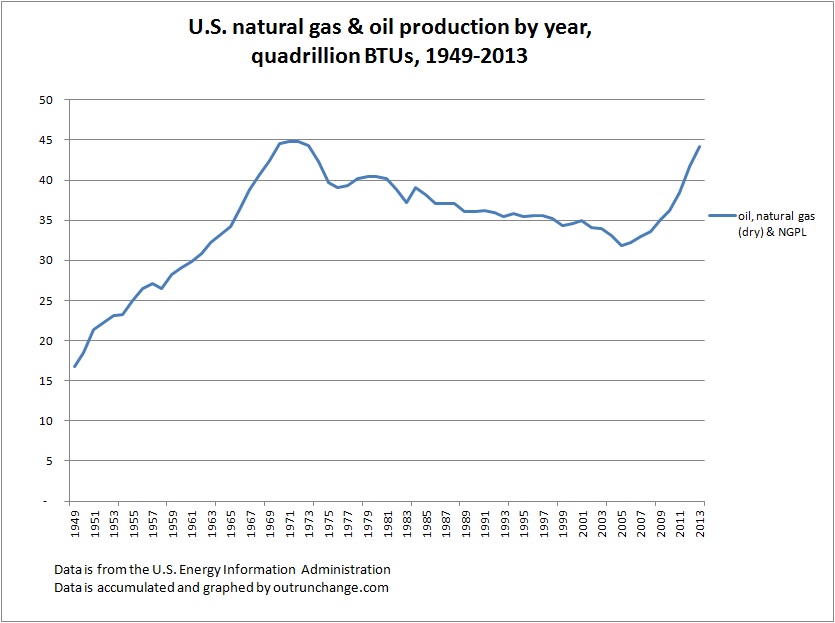
 oil and gas by year 1949 2013

Now, please look for the permanent, inevitable decline trending to zero after the never-to-be-achieved-again peak oil point of 1970. Also look for the inverted-V shaped drop after the peak that mirrors the runup.

Continue reading “What Peak Oil? – #35”
More good stuff on the Bakken – 7/24

Here’s a few quick notes on interesting news that I won’t cover in a separate post: production levels, a forecast for slowing acceleration of output, employement, infrastructure, and  few other things.

Production level

7/16 – North Dakota oil production passes 1,039,000 BOPD in 5/14

5/30 – Million Dollar Way – That She Is! A Million-Bbl Bakken Well In This Boom – One well has finally crossed the point of producing 1,000,000 barrels of oil. It has been on-line for about 3.5 years. Let’s assume $90/barrel. That would be $90,000,000 gross, or about $26M per year. Still producing 24,000 bbl a month, which at $86 is about $2,000,000 each month. Not even on a pump yet. Initial production was an okay 803 barrels a day. Not great. Not bad. By 12/14, it will have produced $100M of oil.

5/30 – Bakken Shale – Is the Bakken America’s Last Boom?Continue reading “More good stuff on the Bakken – 7/24”

North Dakota oil production passes 1,039,000 BOPD in 5/14

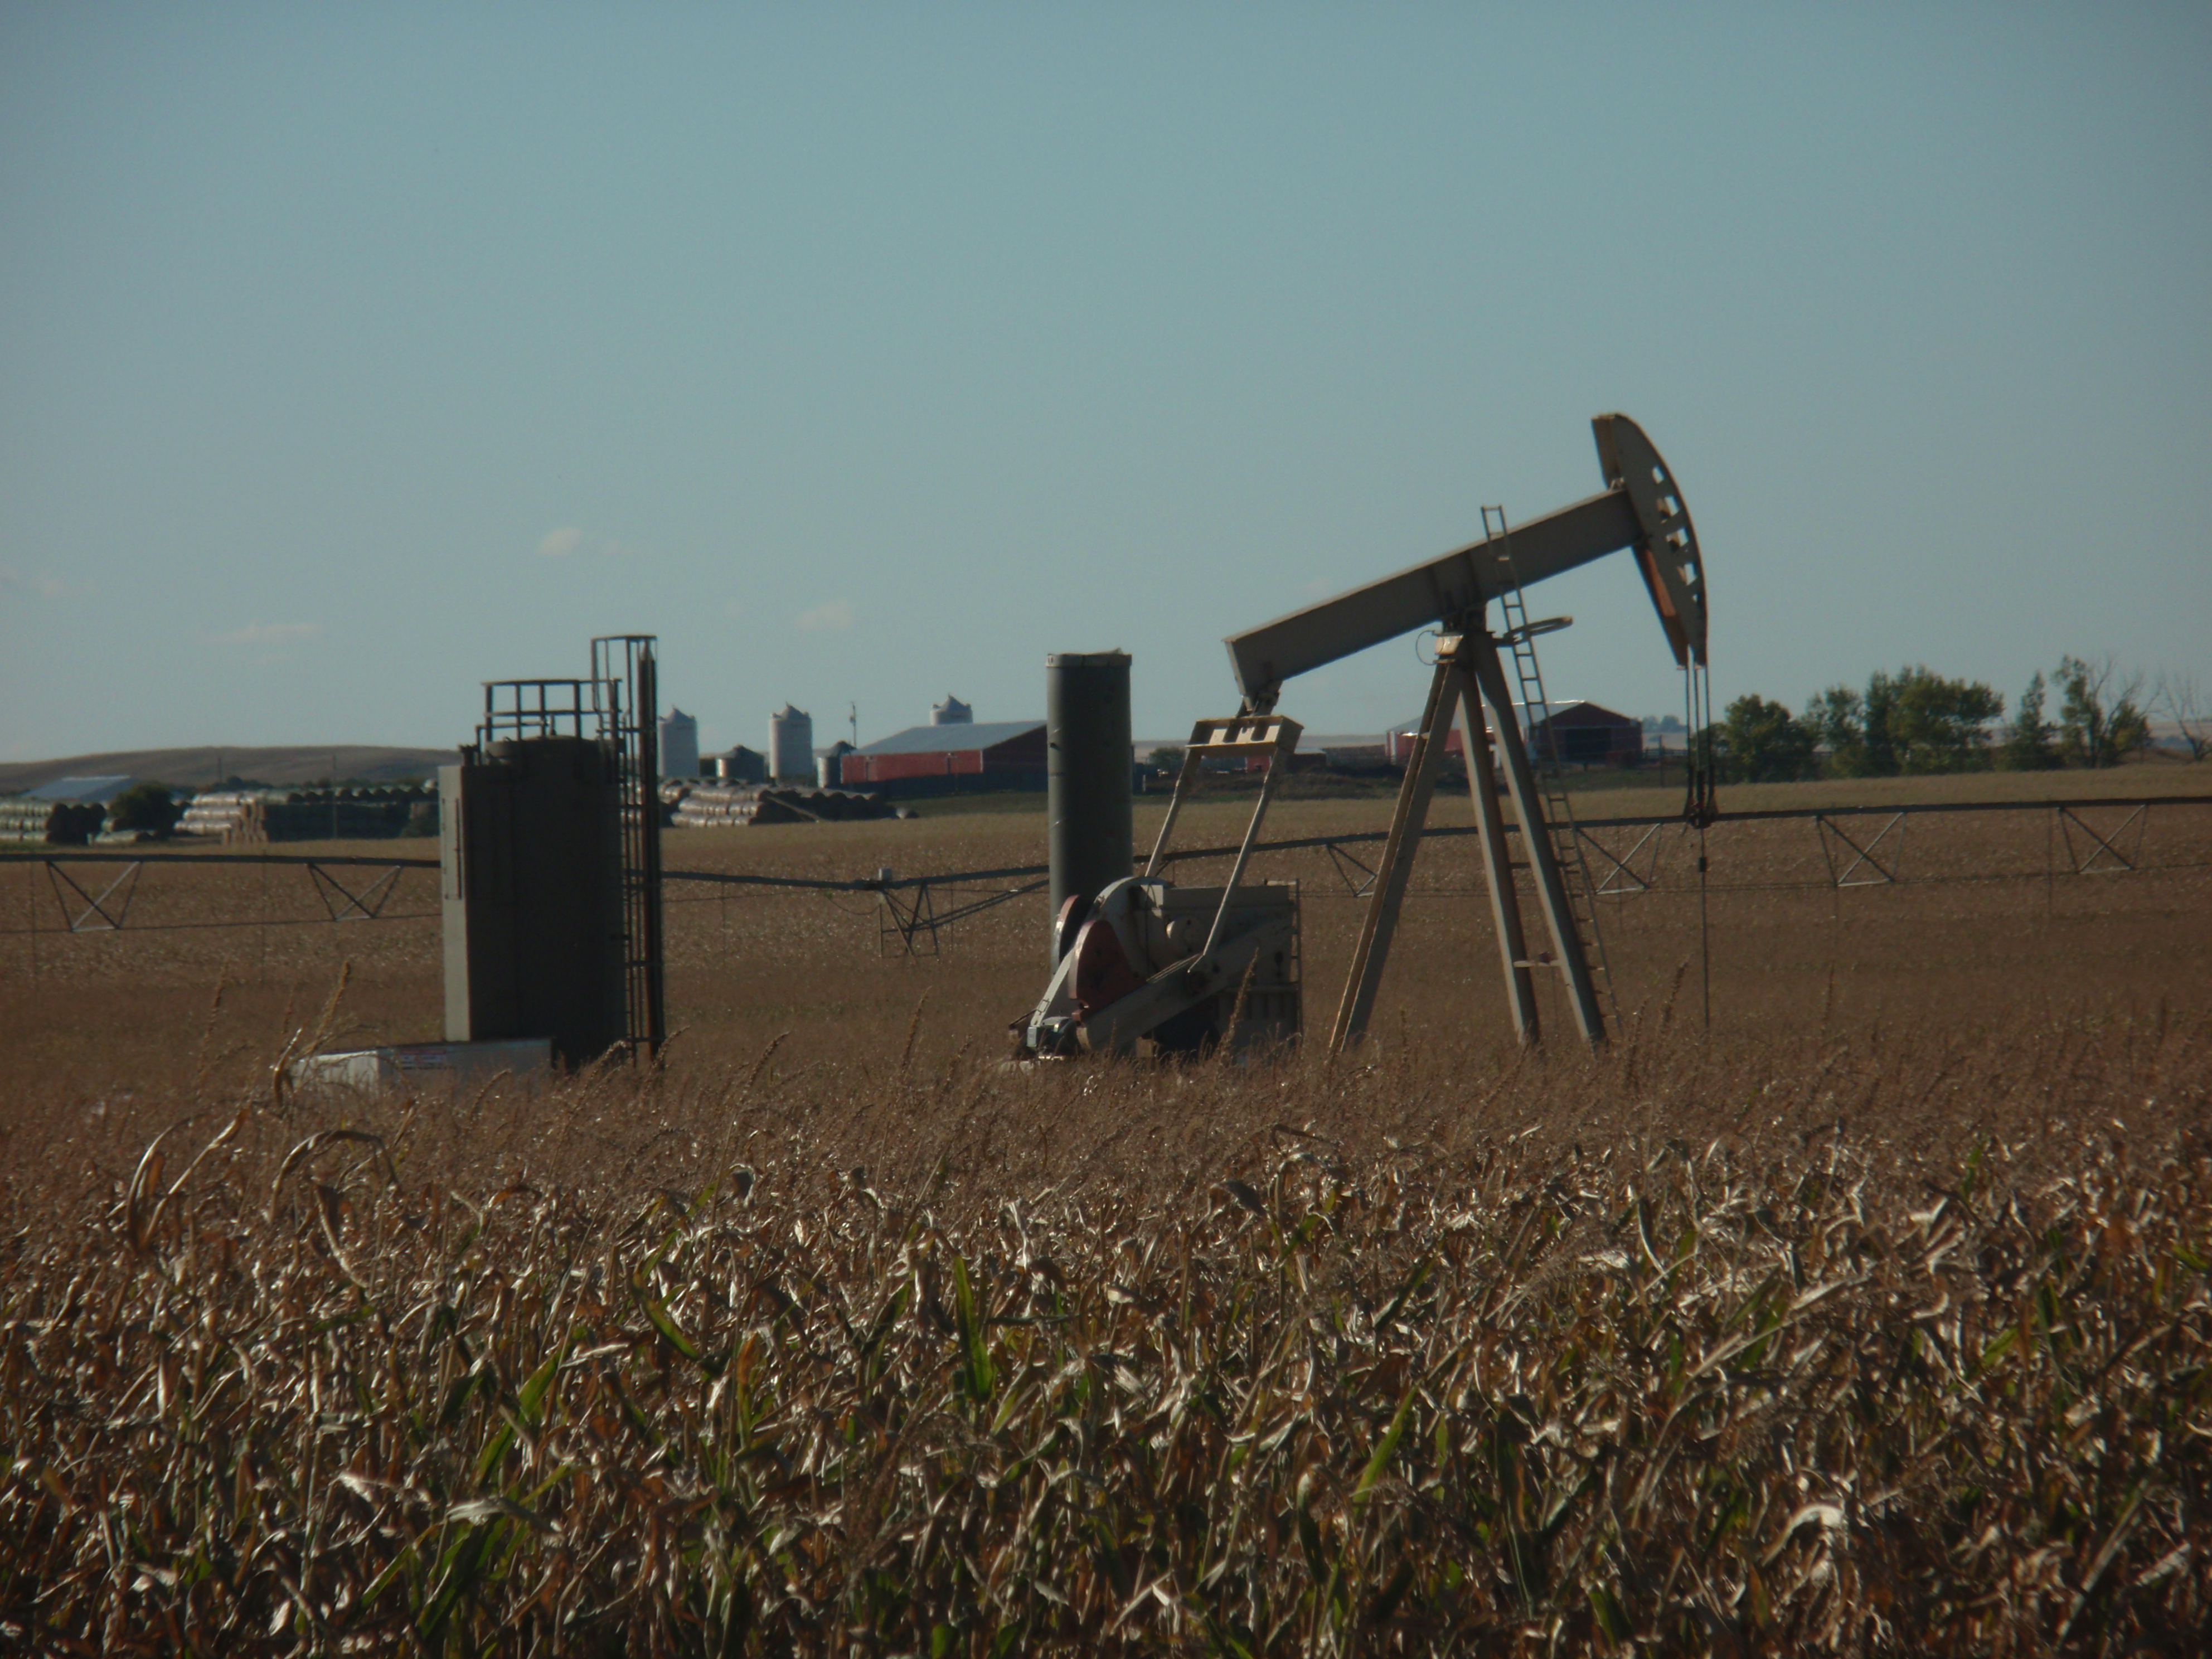
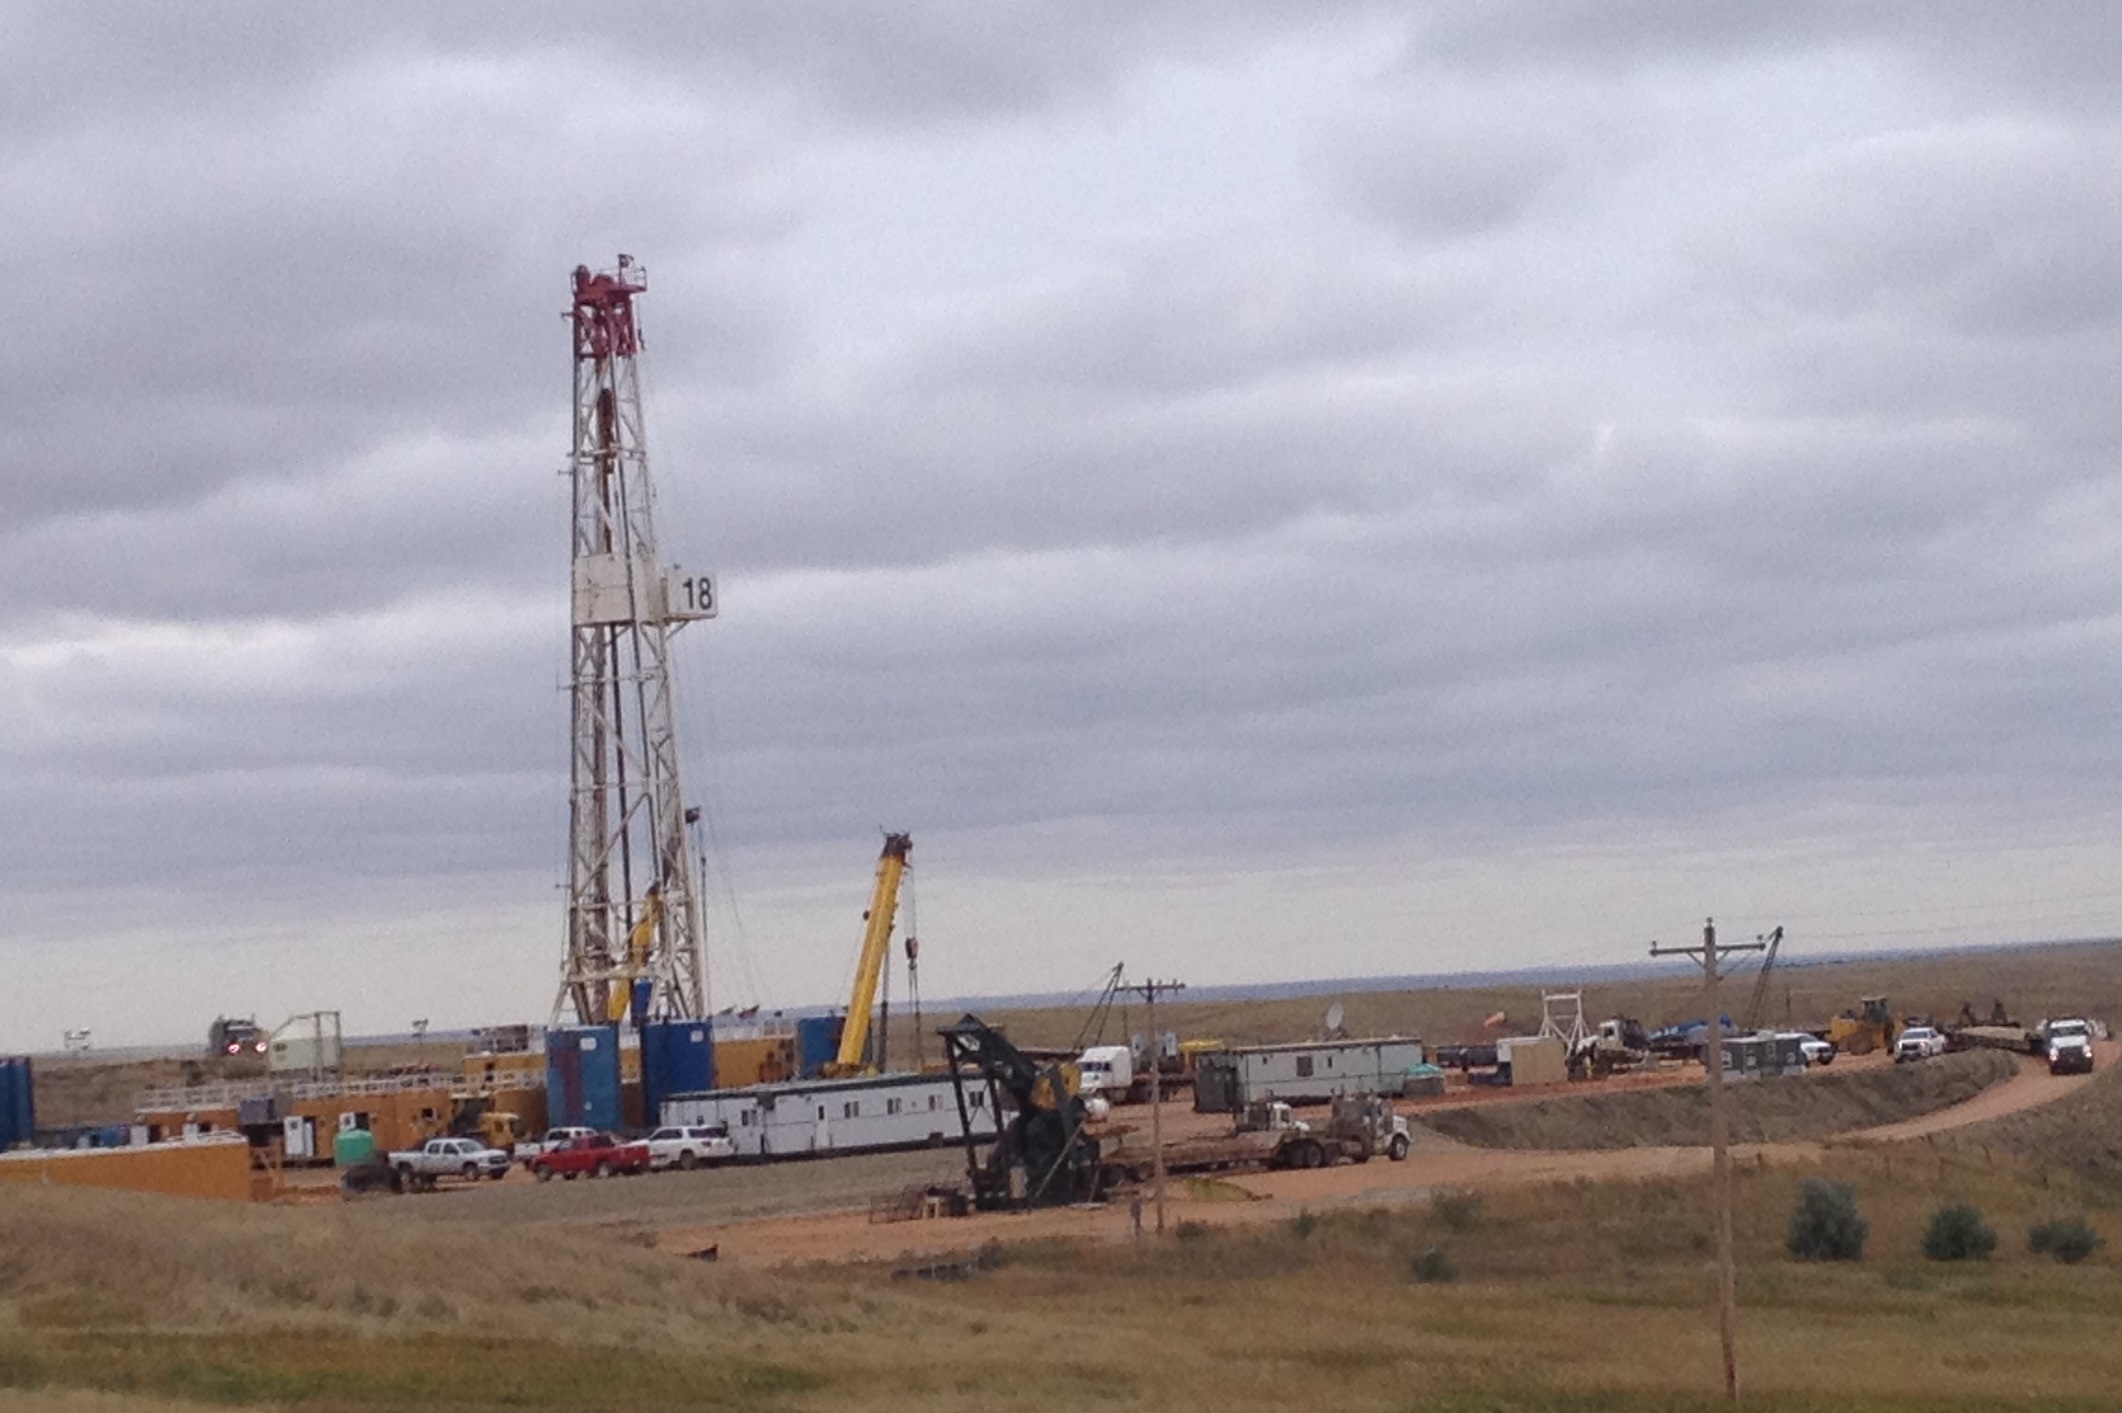
Check out this pump working away to bring oil to the surface so you can drive your car. Shaky photography courtesy of James Ulvog.

[youtube=http://youtu.be/3ZYVN_7PG_M]


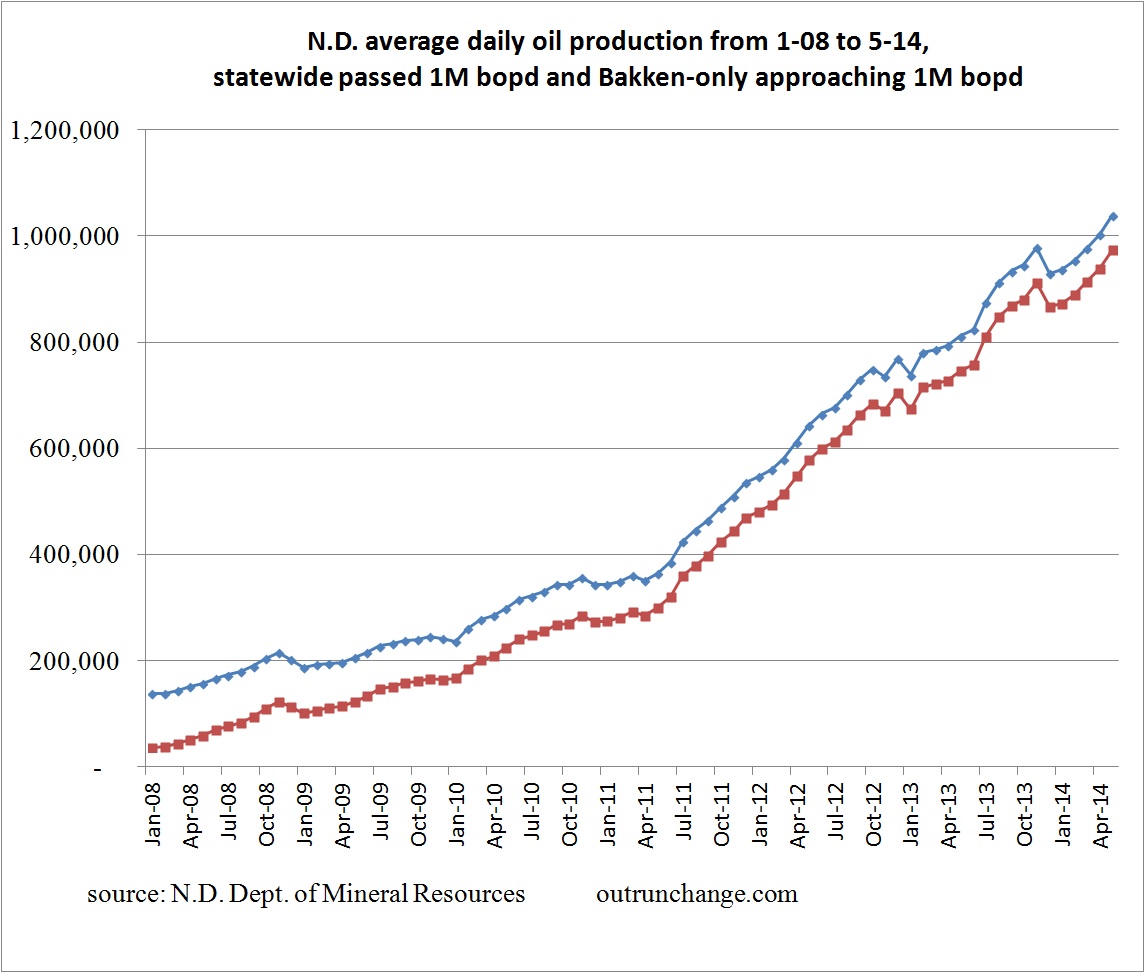
Preliminary production data for the state is 1,039,635 barrels per day average in May 2014. That will be revised up a smidgen over the next two months.

At the average price for the month provided in the Director’ Cut report of $88.31 for 32.2M barrels, that is an economic output of $2.84 billion for the month. Very cool.

Here’s a few graphs:

Monthly production since 2008:

ND production 5-14

Two more  –

Monthly production since 1990:

Continue reading “North Dakota oil production passes 1,039,000 BOPD in 5/14”

A few records set by North Dakota and the Bakken field

North Dakota has set several records in oil production.

In her article, Amy Dalrymple, N.D. oil production hits 1 million barrels per day reminds us of a few records that I’ve read elsewhere: Continue reading “A few records set by North Dakota and the Bakken field”

What’s it cost to run an oil well for a year?

I’ve been wondering about that. Million Dollar Way quotes some comments from a Google Discussion Group that gives some info: Monthly Costs For Maintaining An Active Well…

Most companies estimate production costs at $6,000 to $8,000 per month per well…or $70,000 to $100,000 per year.

Keep in mind that a majority of wells require a week or more of maintenance each year with a workover rig with support equipment and crew at $10,000 plus per day.

You also have significant power costs in addition to general lease operations. A 6-8 well pad could easily require $750,000 to $1 million per year to keep everything in top condition to maximize production without any major operational downhole problems.

Since I’m an accountant, I’ll convert that background into a specific calculation adding in a few of my assumptions. Continue reading “What’s it cost to run an oil well for a year?”

North Dakota oil production passes the 1 million barrels per day mark in April ’14.

OLYMPUS DIGITAL CAMERA

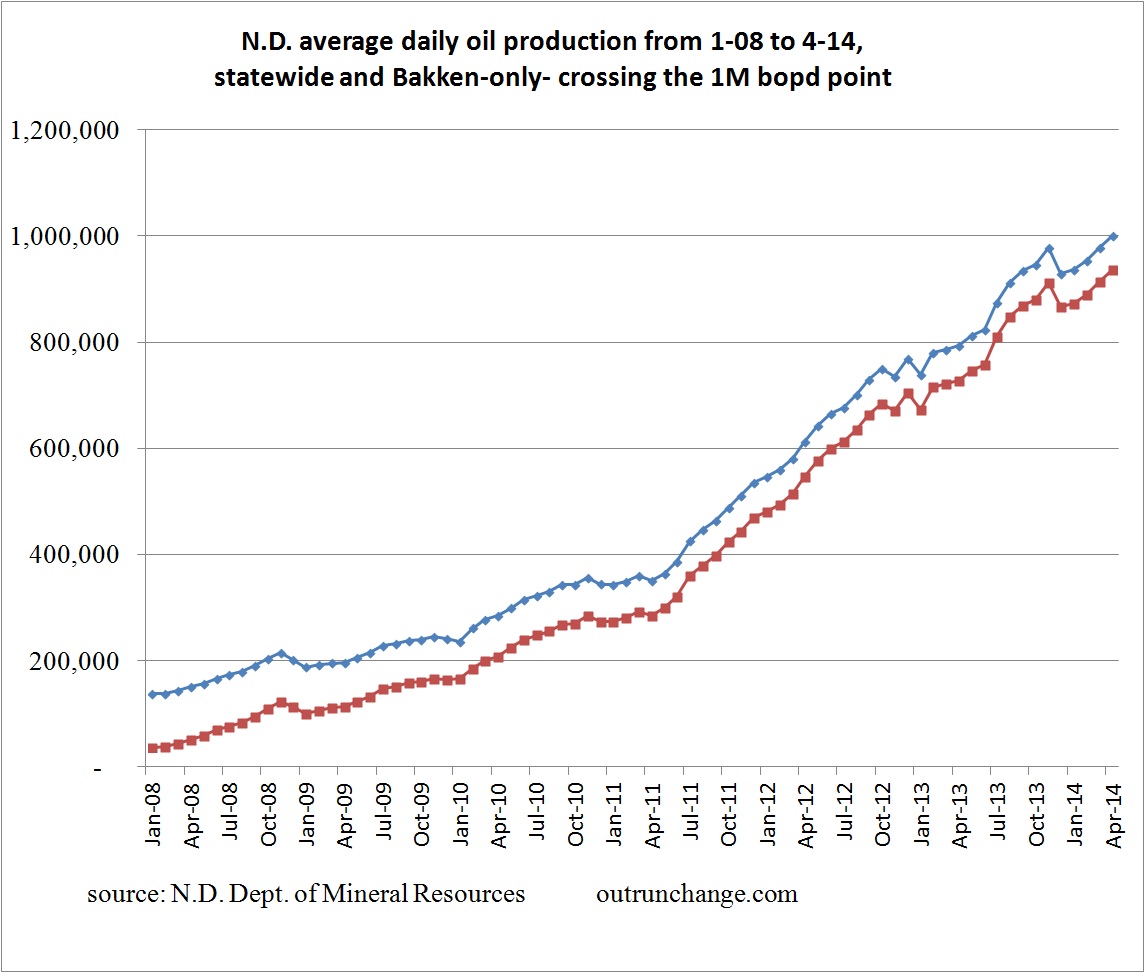
April marked the month that the average production passed the 1 million point. Preliminary number is 1,001,149.

Everyone has been waiting for this day. Yippee!

Here’s a graph of production for state-wide and Bakken-only:

ND production 4-14


Predictions

Continue reading “North Dakota oil production passes the 1 million barrels per day mark in April ’14.”

The shale revolution shown in a graph

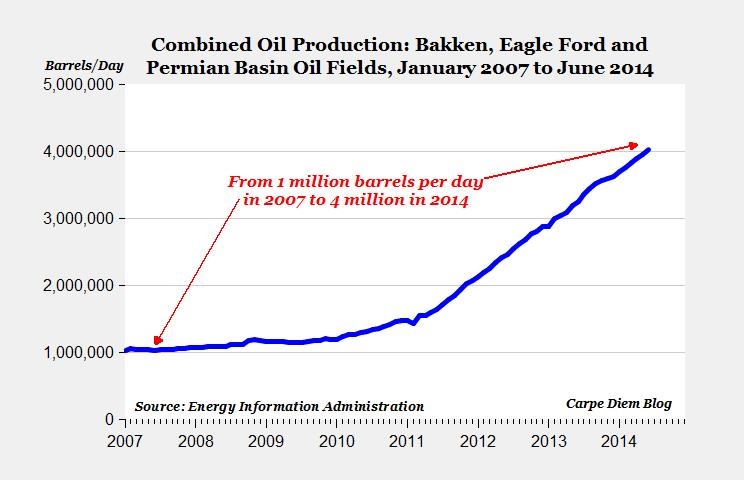
If you want to see what a radical change is underway in the energy field, check out this graph of combined oil production from the three biggest plays, Bakken, Eagle Ford, and Permian:


combined production 3 fields 6-14


That’s from America’s Amazing Shale Revolution in one chart by Carpe Diem and is used with permission.

Continue reading “The shale revolution shown in a graph”

Dry holes in Bakken? Oh, wait. Look at the completion dates.

I read most of the posts from Million Dollar Way but just browse the production reports. Check out this one: Random Updates on Privratsky Wells: Different Fields; Different Operators

I dropped my jaw on first glance. Dry holes!

In my minimal understanding, historically getting a dry hole when looking for oil is a serious risk. You pour a bunch of time and money into drilling a spot and you get……nothing. I’ve read that in Bakken over the last five years there aren’t any dry holes.

Imagine my shock when I browsed the linked article glancing at the initial production rates in barrels per day and saw DRY.

Continue reading “Dry holes in Bakken? Oh, wait. Look at the completion dates.”

Mind bending tidbits from ’14 Bakken conference

Check out these astounding pieces of info from the 2014 Williston Basin Petroleum Conference, as reported by Amy Dalrymple (who else would it be from?): Hamm sees 2 million barrels per day potential for North Dakota: Continue reading “Mind bending tidbits from ’14 Bakken conference”

Shale oil revolution drives surge in domestic production – Peak oil #34

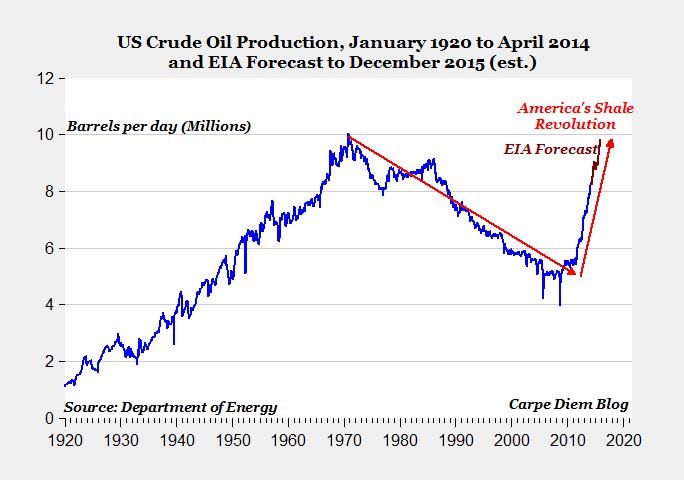
Brace yourself for this chart, used with permission from Carpe Diem: Energy chart of the day: America’s shale oil revolution will reverse a 40-year decline in crude oil output in just 5.5 years.


carpe diem oil prod 20 to 15


US energy production grew from around 1 million barrels of oil per day (1M bopd) in 1920 to a high point of 10.04M bopd in November 1970. A 40 year decline dropped production to around 5M or 5.5M bopd in 2010.

The shale boom has skyrocketed production to 8.3M bopd in April 2014. The EIA projects production will be pushing 10M bopd at the end of 2015.

Astounding.

What Peak Oil?

Continue reading “Shale oil revolution drives surge in domestic production – Peak oil #34”

N.D. oil production in 3/14 recovering from winter slump

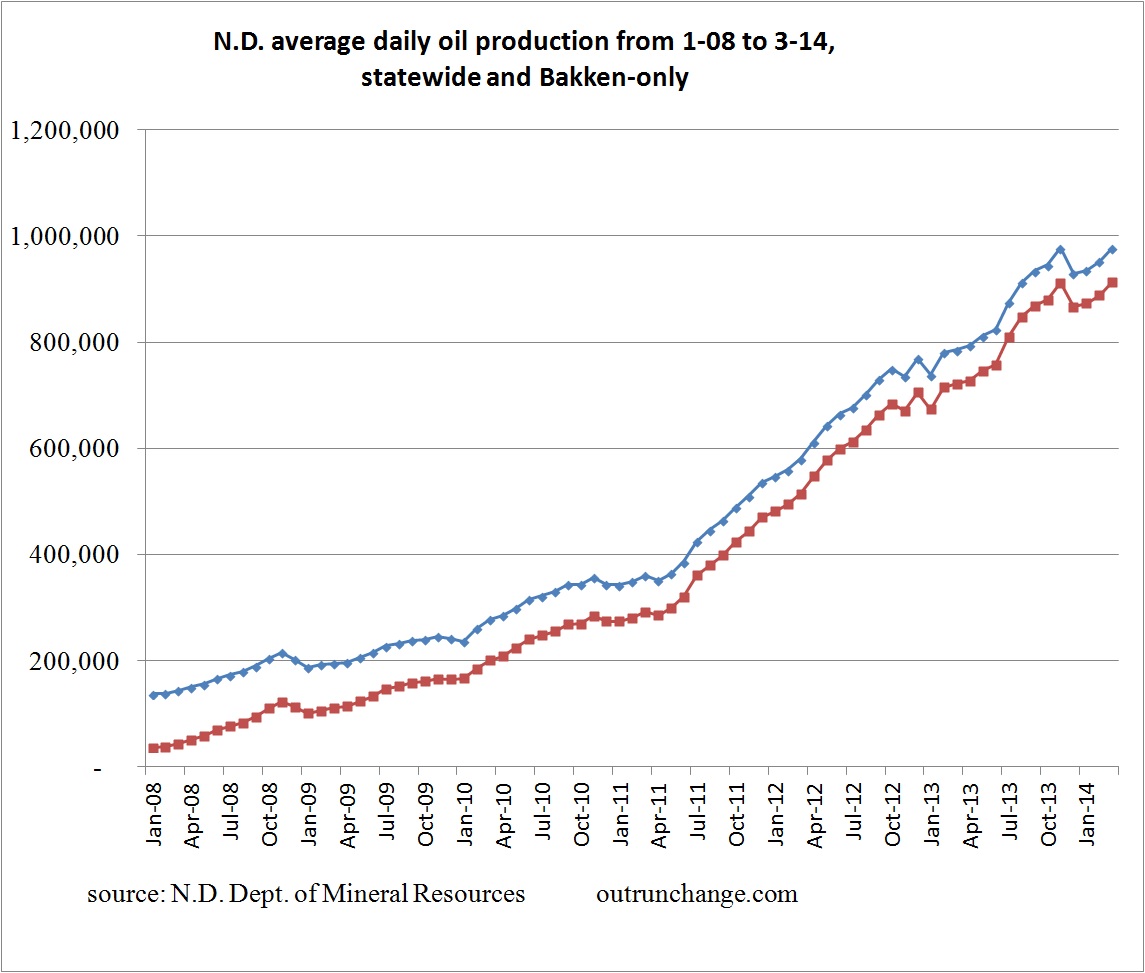
Oil production in North Dakota hit 977,061 barrels per day (bopd) in March. Looking at the top of the trend line takes a bit of care. The initial report for November 2012 was 973,280 bopd. When another dozen wells reported results, the average production was 977,599 in November. The updates increased production data by 4,219 bopd. That means the March data is the record high for the initial report, but is still about 500 bopd behind the updated record high.

Here is a graph of the production with updated data, not the initial reports:

3-14 bakken and statewide

Background info:

Continue reading “N.D. oil production in 3/14 recovering from winter slump”

What a really good Bakken well looks like, or, with these numbers do you really care if a well drops daily production by two-thirds in a year?

If you could make an investment in a productive asset that would have a gross return just under four times your initial amount in 12 months, would you care how quickly the investment fell apart after that?

Let me be more specific. If you could invest $8M in an oil well that produced $30.7M of oil in the first 12 months of production, would you care how fast the production dropped after that? Would you care if the well had that horrid Bakken decline rate?

Continue reading “What a really good Bakken well looks like, or, with these numbers do you really care if a well drops daily production by two-thirds in a year?”

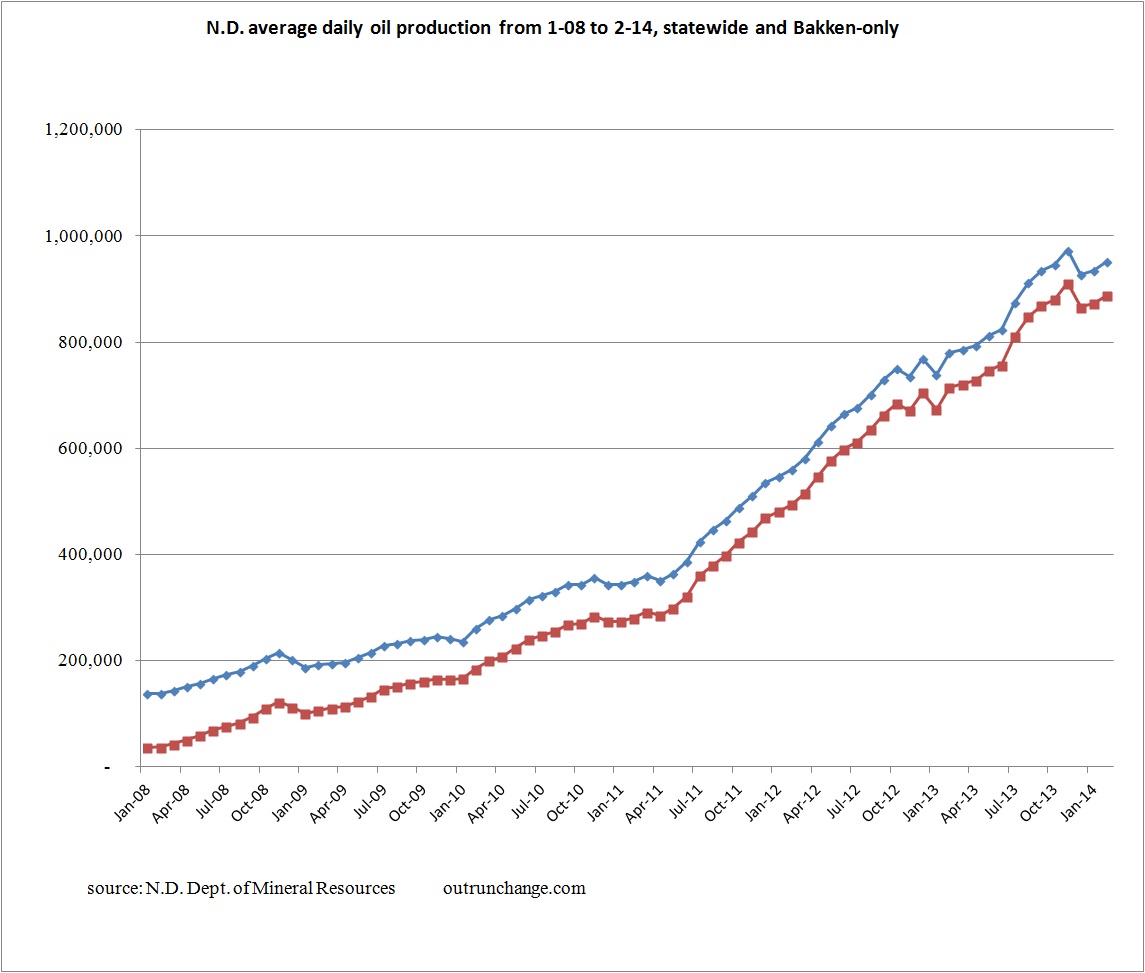
Oil production in North Dakota starts to recover from winter slump – 951,350 bopd average in February ‘14

Here is an updated graph of monthly production in the state, for the Bakken fields and whole state.

2-14 bakken and statewide

Can you pick out the winter months just by looking at the graph?

There were 18 days in February with temps 5 degrees lower than the usual frigid, 4 days with high wind that stopped completions, and production stopped on over a hundred wells because a gas processing plant was off-line for upgrades. With all that, production grew 16,224 bopd to 951,350 bopd.

That is off the high of 973,280 in November.

For more info, check out Amy Dalrymple’s report: Helms says curtailing oil production necessary to reduce flaring. Additional news there is planned rules for the state will place a limit on flaring, which will slightly hold back production.