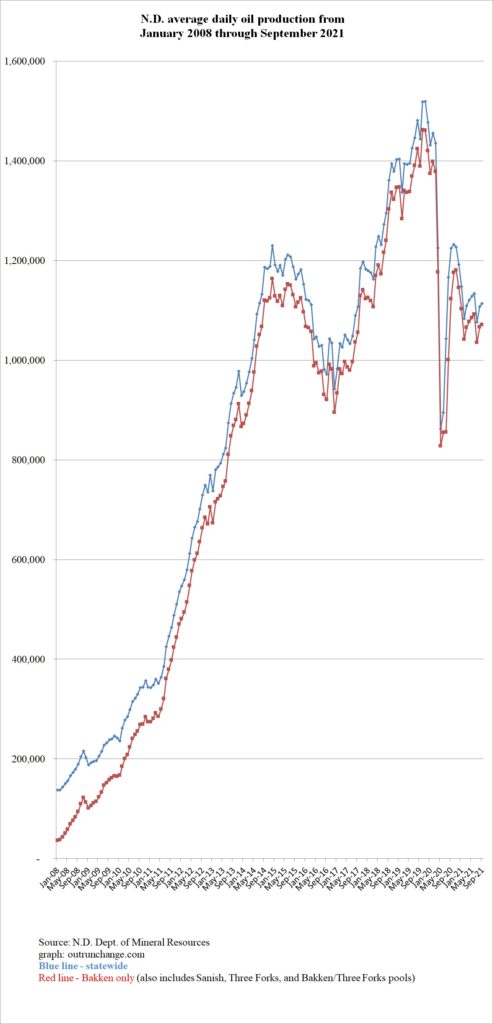
Production of crude oil in North Dakota in September 2021 has been flat for the last 14 months.

Crude oil production averaged 1,113,410 barrels of oil per day (BOPD) in September 2021.

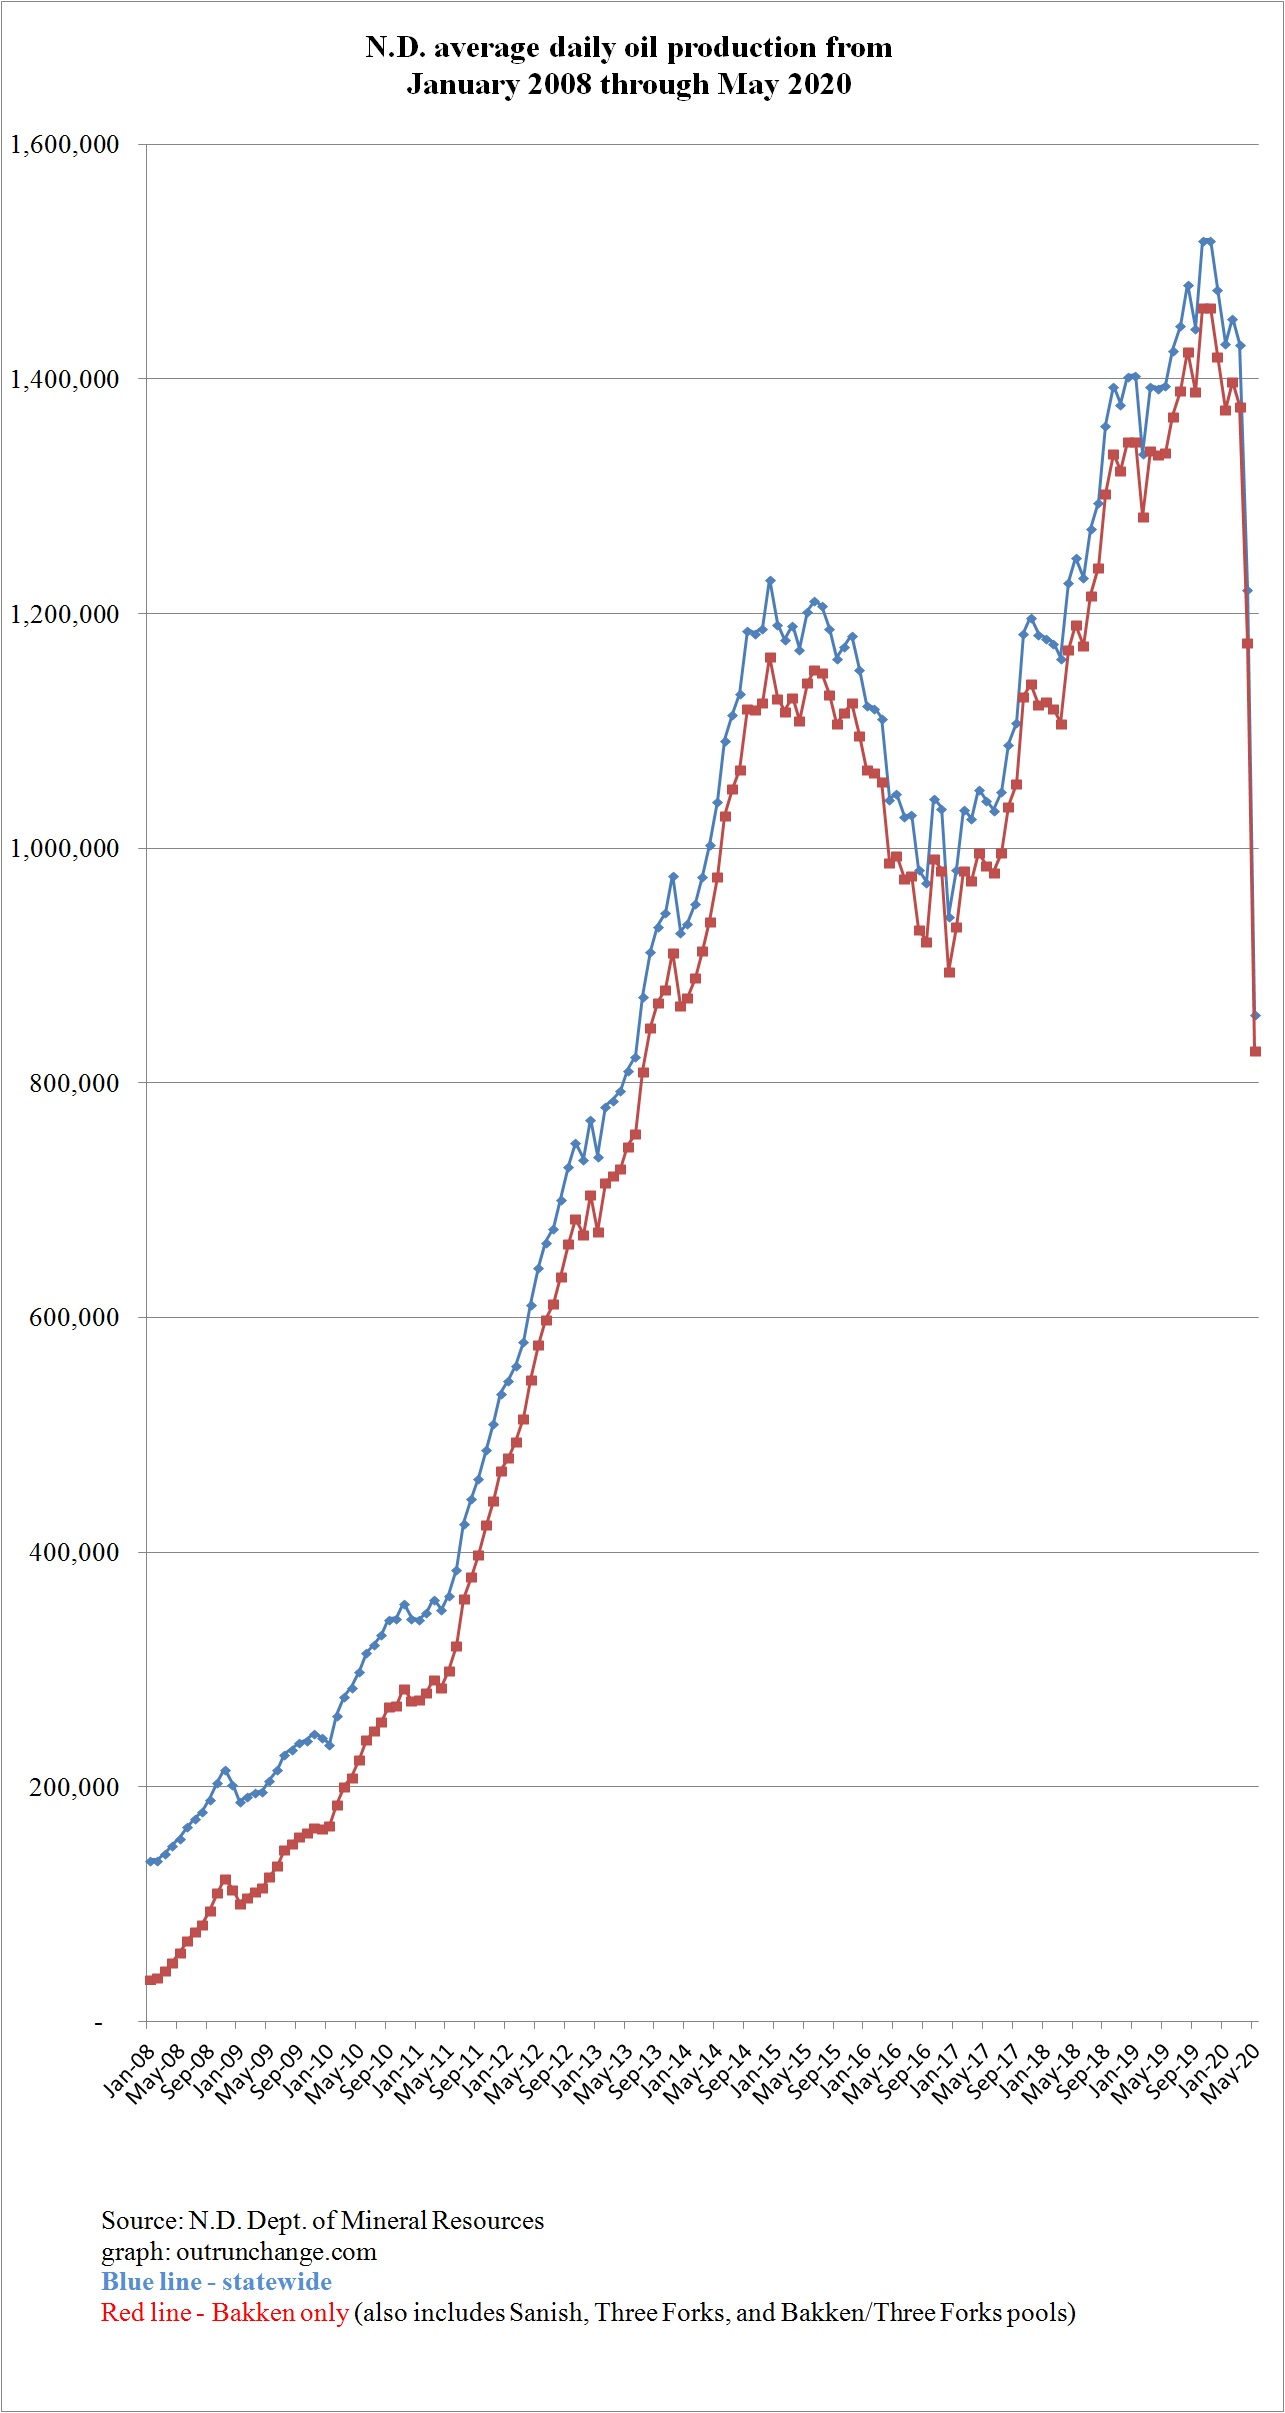
Production has been in the range of 1.1 or 1.2 million BOPD since August 2020. Production was 1.44M BOPD back in March 2020 before the pandemic hit. Production quickly dropped to 0.9M in both May and June 2020 before climbing to around 1.1M since then.

Graph at the top of this post shows average production since January 2008. The blue line is total production in the state with the red line showing production from the Bakken pool only, which also includes the Sanish, and Three Forks pools. The blue line essentially excludes the old wells and areas which have been in production since before the current boom started in the 2008 timeframe. You can easily see the radical impact of horizontal drilling and hydraulic fracturing.

For a longer-term perspective, check out the average production in the state since 1990:

Continue reading “Production of crude oil in North Dakota in September 2021 has been flat for the last 14 months.”
Price of oil and value of crude oil produced in North Dakota – May 2021.

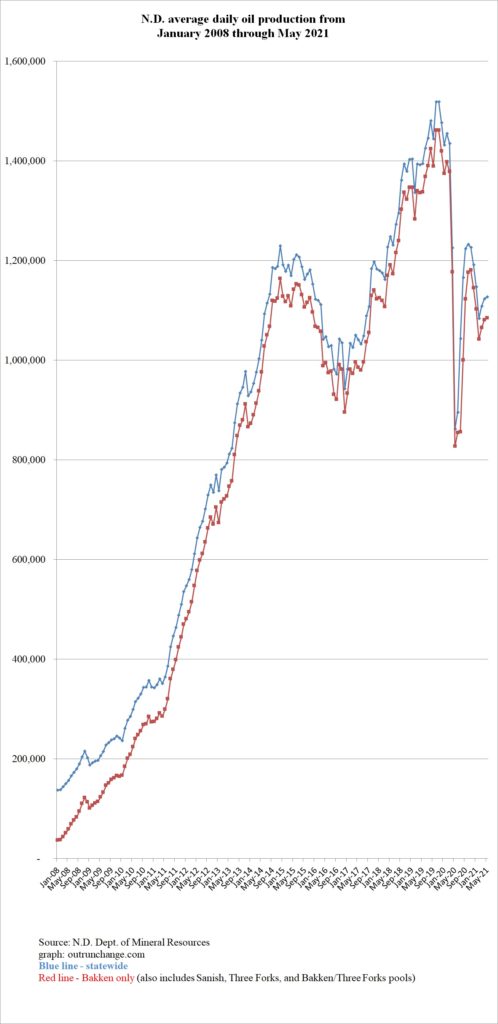
Previous post showed a graph of average daily production in North Dakota. After a record high of 1.52M barrels of oil per day (bopd) in 11/19, production dropped to a seven year low of 862K bopd in 5/20. Production recovered to1.32M bopd in 10/20 before dropping to 1.08M bopd in 2/21 and sitting at 1.12M bopd in 4/21 and 5/21.

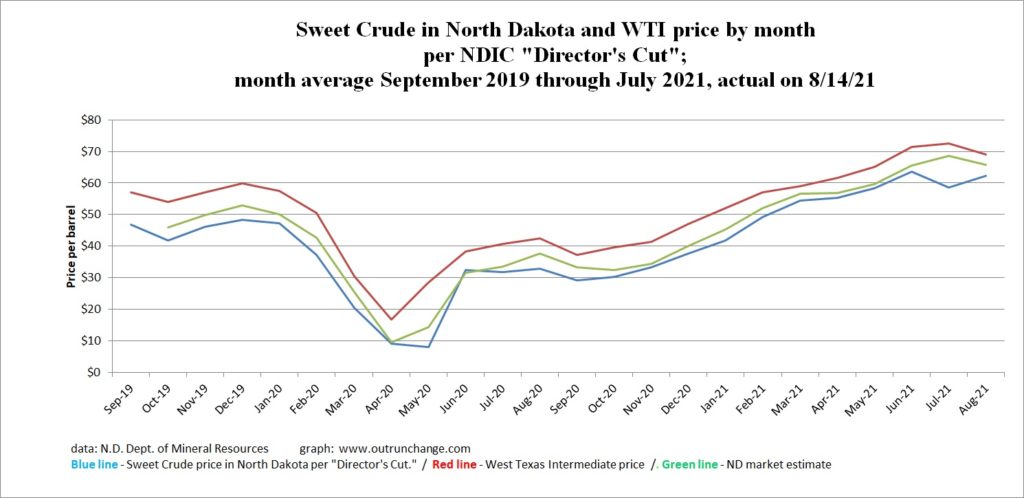
The good news for the state is oil prices have been recovering.

Prices for North Dakota light sweet had been in the $40s to low $50s for 2019 and most of 2020 before dropping and hitting a rocket disrupted price of $9.16 in 4/20 and $7.92 and 5/20.

Prices recovered to $32.35 in 6/20 and then slowly increased to $63.62 in 6/21 and are at average of $50.50 in 7/21.

All those prices are from the North Dakota Director’s Report.

Graph at the top of this post shows the4 North Dakota Light Sweet, West Texas Intermediate, and an estimate for the average price realized in North Dakota.

What does the dramatic swing in prices combined with the dramatic swing in production look like in terms of the amount of revenue realized by producers?

Continue reading “Price of oil and value of crude oil produced in North Dakota – May 2021.”

North Dakota oil production in May 2021 slowly recovering from economic shutdown.

Graph above shows wild swings in oil production in North Dakota during the government shutdown of the economy due to the pandemic. 

Continue reading “North Dakota oil production in May 2021 slowly recovering from economic shutdown.”

Value of oil production by month and recent prices in North Dakota – April 2021.

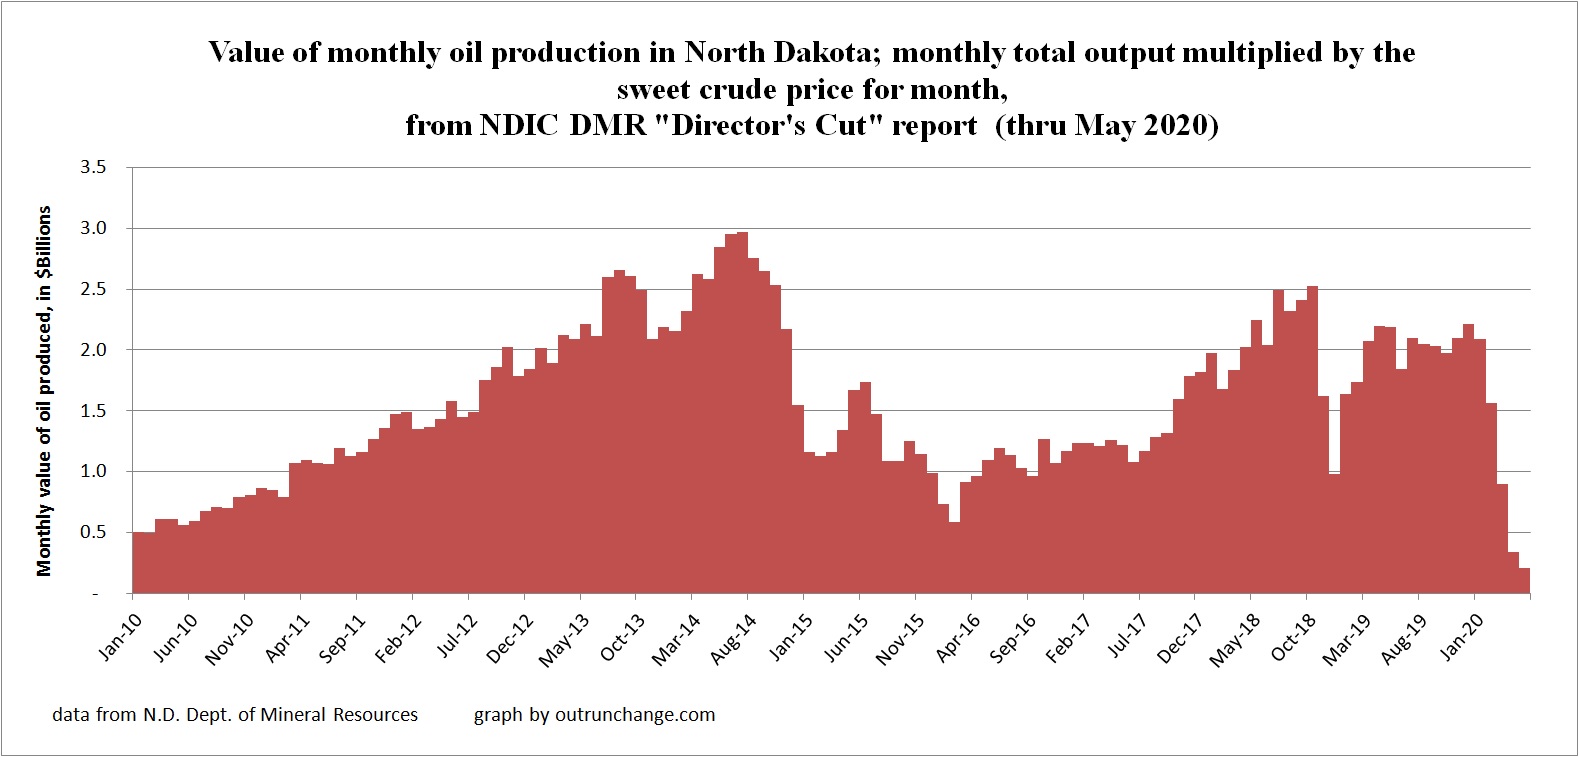
Market price of oil collapsed last spring. In looking at the data by month, you can see a one month lag in the drop of production. As a result, the value of oil produced in North Dakota dropped substantially last spring and summer.

As the price of North Dakota light sweet dropped in March to $20.33 from $37.21 the prior month, production slid about 210k bopd in April to 1.225 bopd.

The shock decline in April 2020 to $9.16 from $20.33 led to a drop of production in May of 363K bopd, with average output down to 862k bopd.

A further drop in May 2020 to $7.92 from the prior $9.16 led to another month of low production in June at 895k bopd, an increase of a mere 33k bopd.

Average prices recovered the next month and then over the next seven months were in a range between $29 and $33. Production increased to the range of 1.0m bopd to 1.2 bopd since prices recovered.

Prices have accelerated in the last four months.

The driver for this wild roller coaster ride can be seen in the average of monthly prices:

Continue reading “Value of oil production by month and recent prices in North Dakota – April 2021.”

Oil production in North Dakota mostly recovered after slump last spring but now dropping with winter weather.

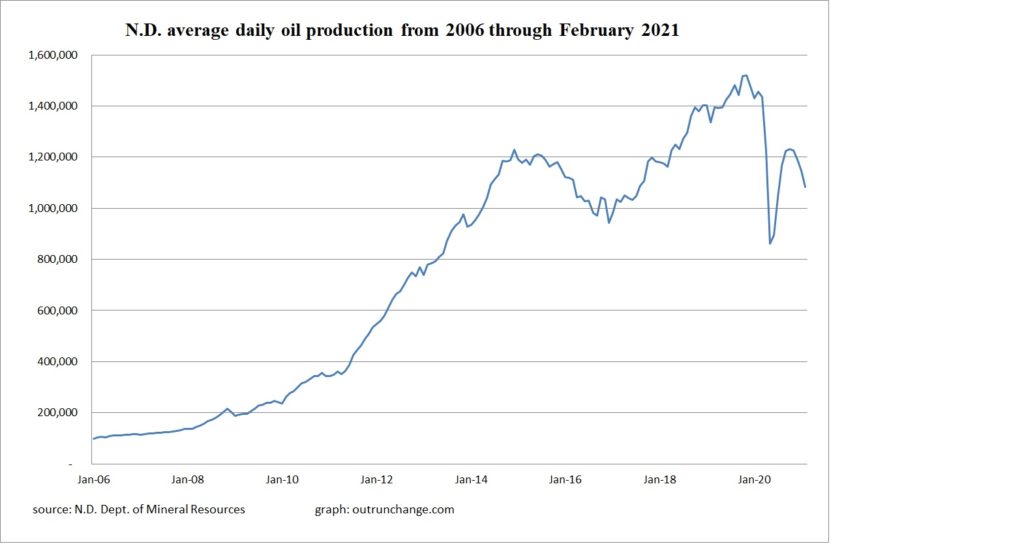
Graph above shows dramatic drop in production back in May and June 2020, caused by the drastic drop in prices. Record output in November 2019 of 1,519,032 bopd slowly declined then took a sharp drop to below 900,000 bopd in May and June.

Recovery thereafter increase production to just over 1.2M bopd in September, October, and November 2020. Production since then has dropped, with a significant decline in February 2021.

From high of 1,519,032 bopd in November 2019, two low of 862,349 bopd in May 2020, to high of 1,226,549 bopd in November 2020, to drop due to the weather of 1,083,020 bopd in February 2021.

Quite a roller coaster, huh?

For more detail and to drill down deeper, including Bakken/Three Forks only and statewide data, check out:

Continue reading “Oil production in North Dakota mostly recovered after slump last spring but now dropping with winter weather.”

Forecast for oil activity in Bakken.

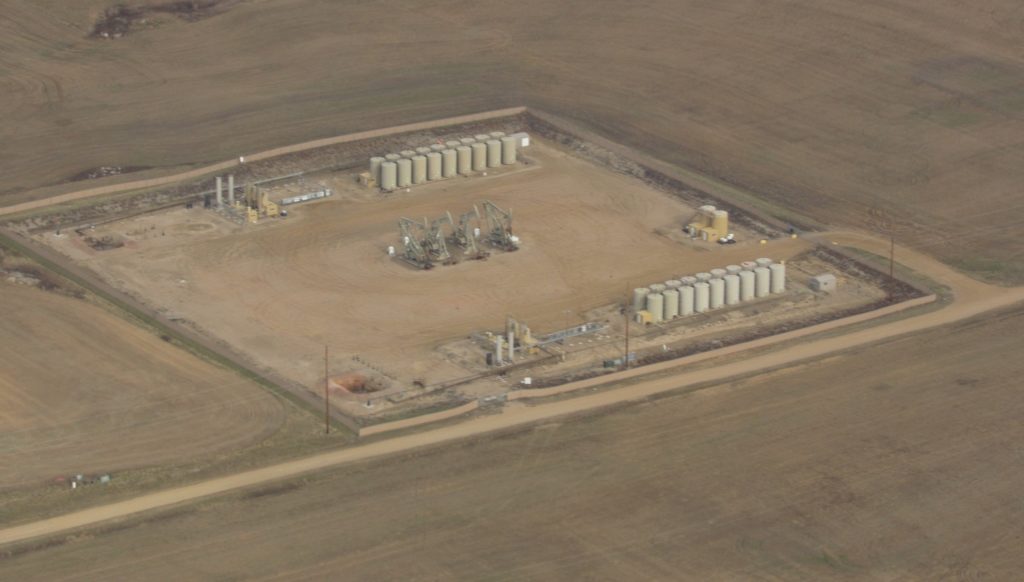
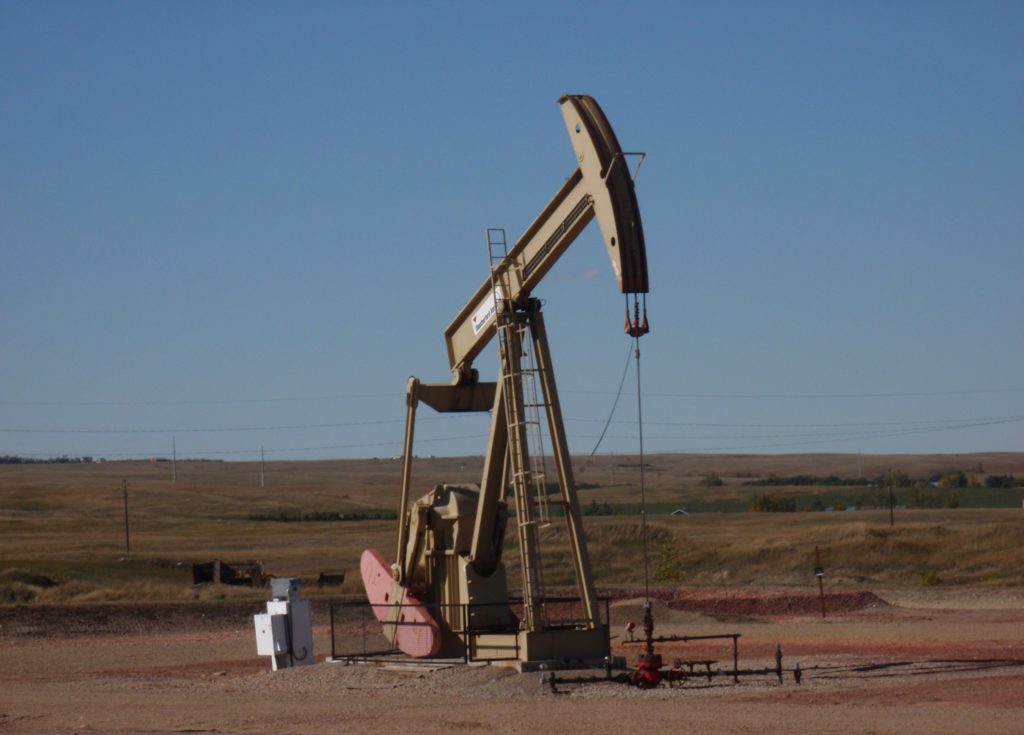
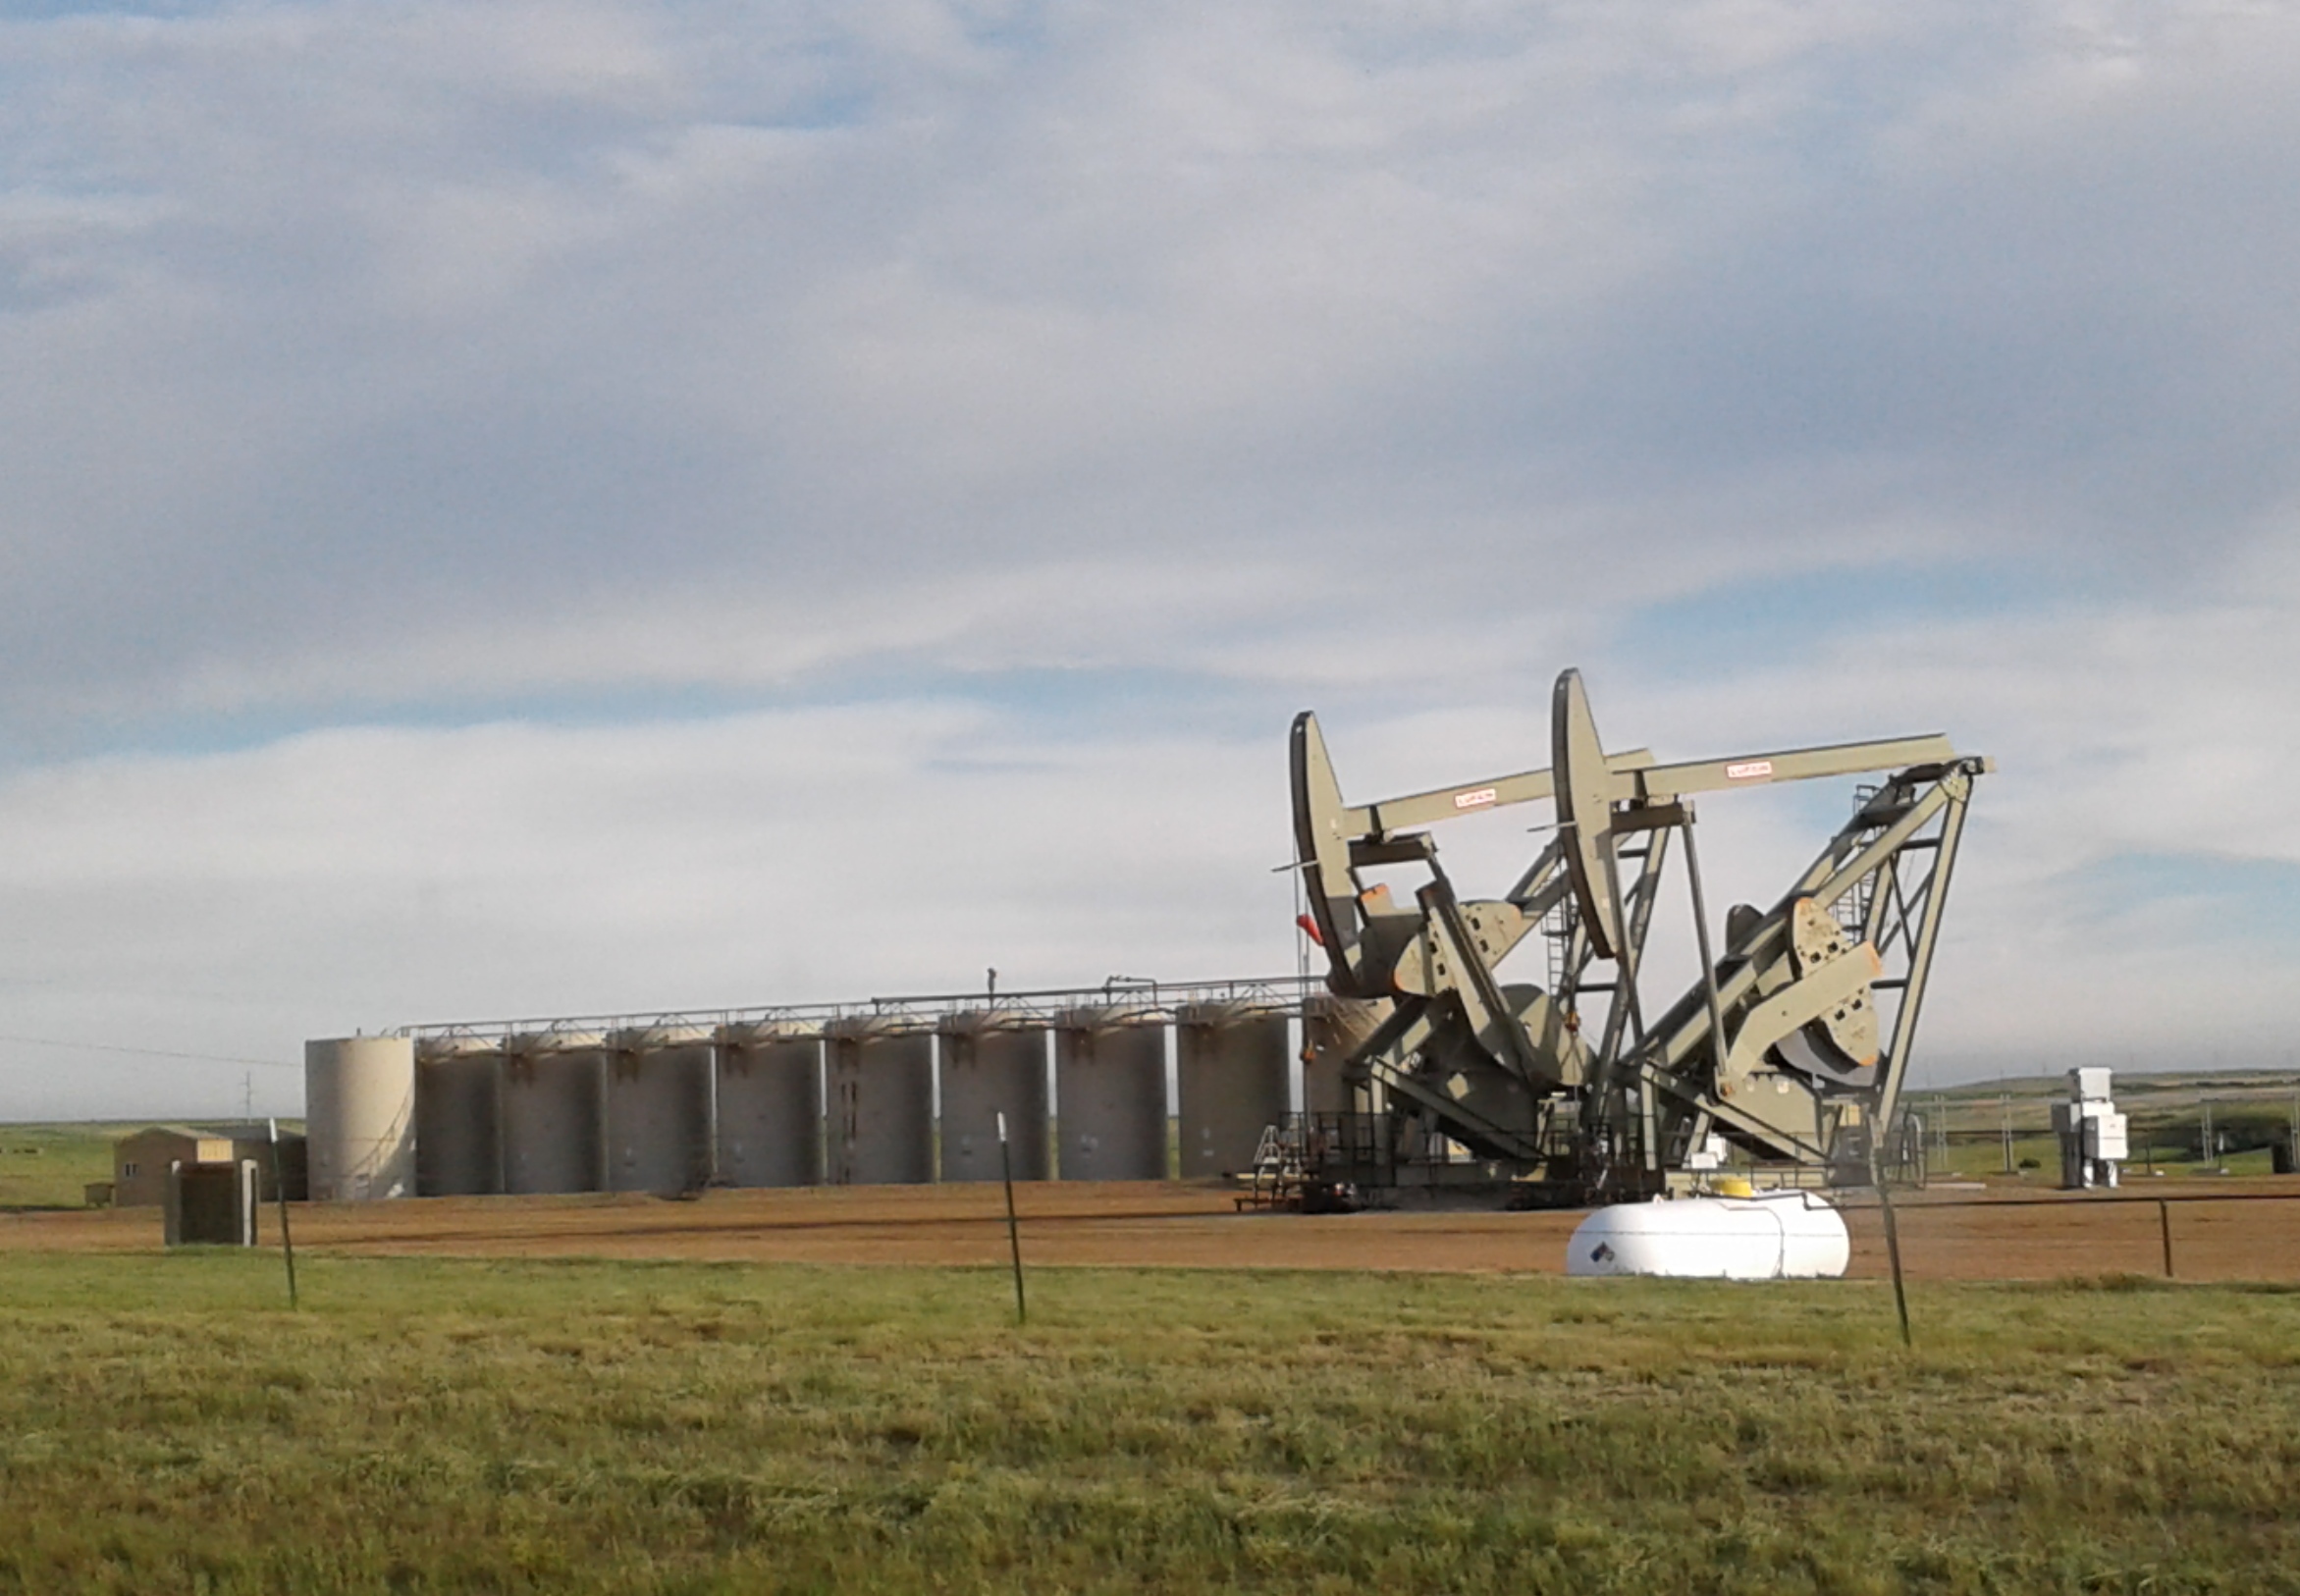
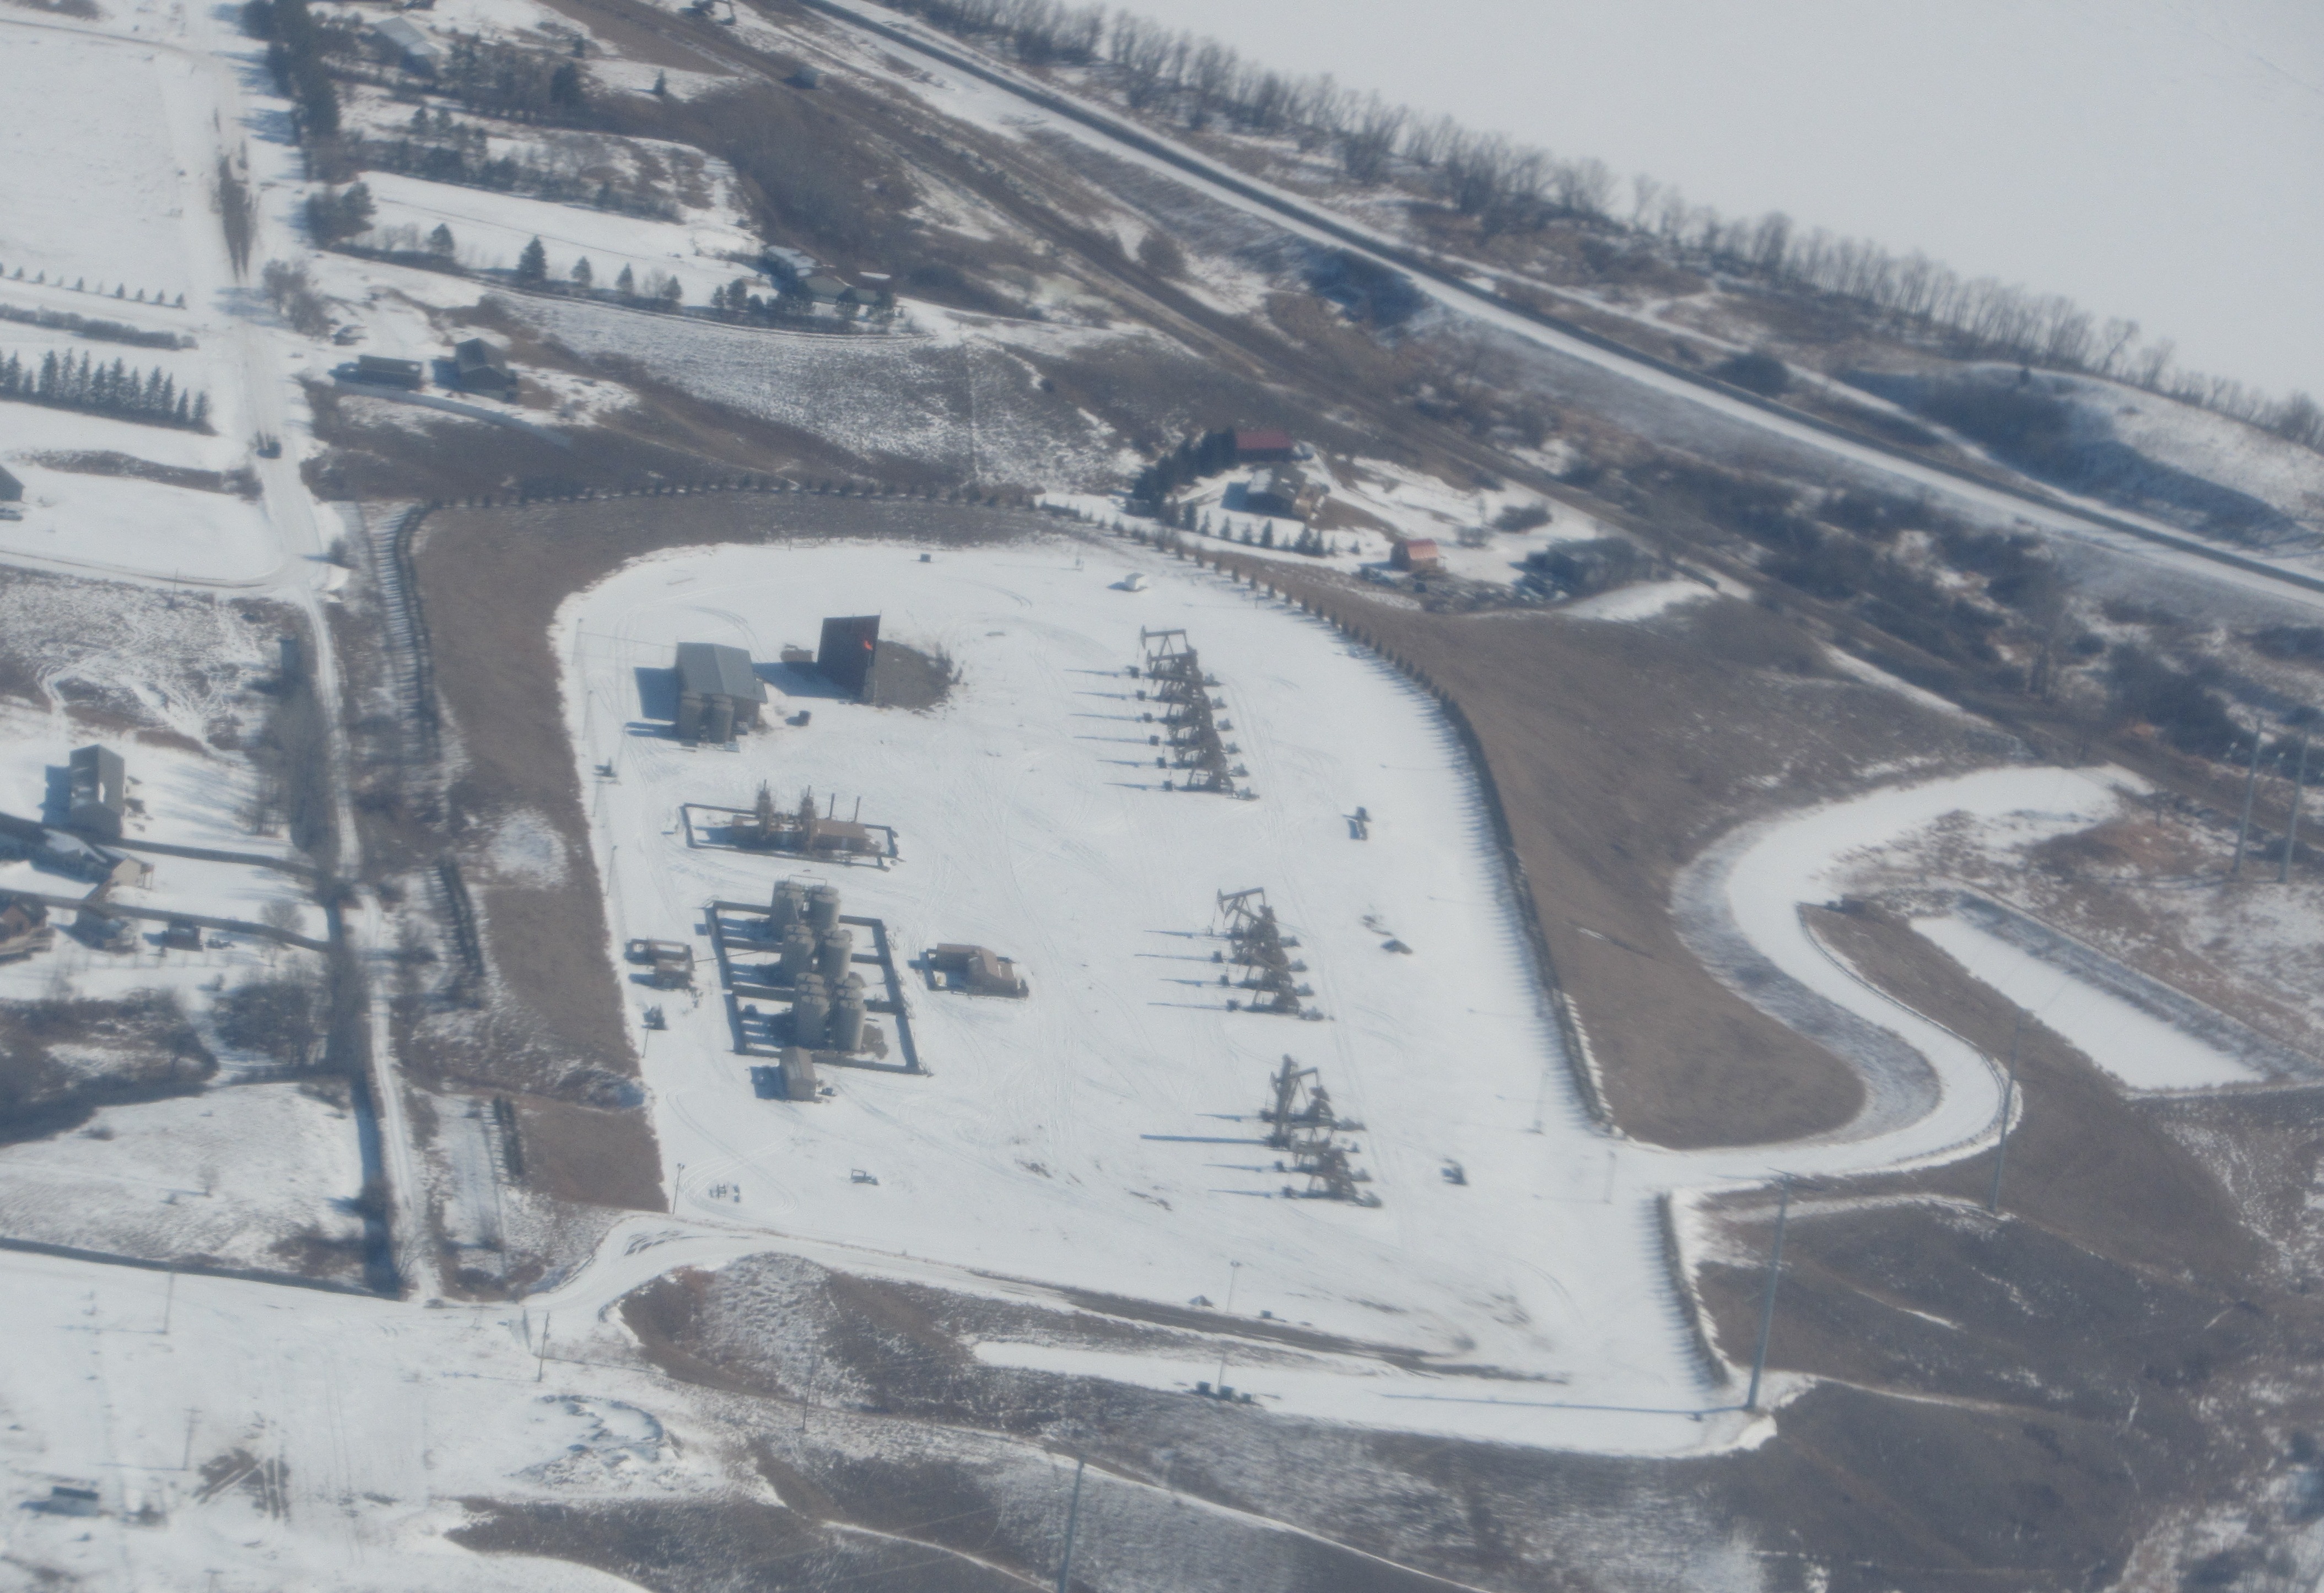
Notice the massive amount of unused space and the large number of storage tanks. Eventually there will be one or two more rows of wells with perhaps 10 wells in each row. Only four pumpjacks at the moment. This photo hints at the amount of future drilling. Photo by James Ulvog.

What are the prospects for drilling and oil production in the Bakken oil field in North Dakota? Particularly in regards to Williams County, what does the near future hold?

With all the turmoil in the oil industry lately, haven’t had much discussion here on what the future holds.

The Million Dollar Way blog had a great commentary by Bruce Oksol on 4/8/21: Idle Rambling In Response To A Reader’s Question.

The reader asked if there is likely to be any future development around Williams County, or on the other hand, if there is any acreage left to develop.

Continue reading “Forecast for oil activity in Bakken.”

Annual production of crude oil in North Dakota for 2020.

Photo by James Ulvog.

Value of the crude oil produced in North Dakota dropped in 2020 due to the drop in demand caused by the pandemic. This produced a double hit: drop in volume and drop in crude oil prices.

Values calculated by multiplying the production volume by the average price of North Dakota light sweet in the state as mentioned in each months Director’s Report.

Value of production in the last four years has been:

  • $16.2B – 2017
  • $24.1B – 2018
  • $24.1B – 2019
  • $13.0B – 2020

In graph form, this looks like a roller coaster ride:

Continue reading “Annual production of crude oil in North Dakota for 2020.”

Oil production in North Dakota continues recovery in August 2020.

Parked wells west of Williston, ND in August 2020. Photo by James Ulvog.

As shown in the following graph, crude oil production increased again in August 2020. It is up 122,351 barrels of oil per day (bopd) over revised July amount, which follows a 148,343 bopd increase over June.

Continue reading “Oil production in North Dakota continues recovery in August 2020.”

Value of oil production in North Dakota also starting to recover.

Photo by James Ulvog.

Previous post mentioned the volume of production in North Dakota is starting to recover. It is still down dramatically from the last few years. Production past the 1.04M bopd level back in April 2017 and has been above that level until the pandemic hit and Saudi Arabia started flooding the market.

Two graphs showing the production levels can be seen on the previous post.

The price of oil has recovered from the lows during the shock back in April and May. Check out the price of West Texas Intermediate, North Dakota sweet crude, and estimated prices realized in the state:

Continue reading “Value of oil production in North Dakota also starting to recover.”

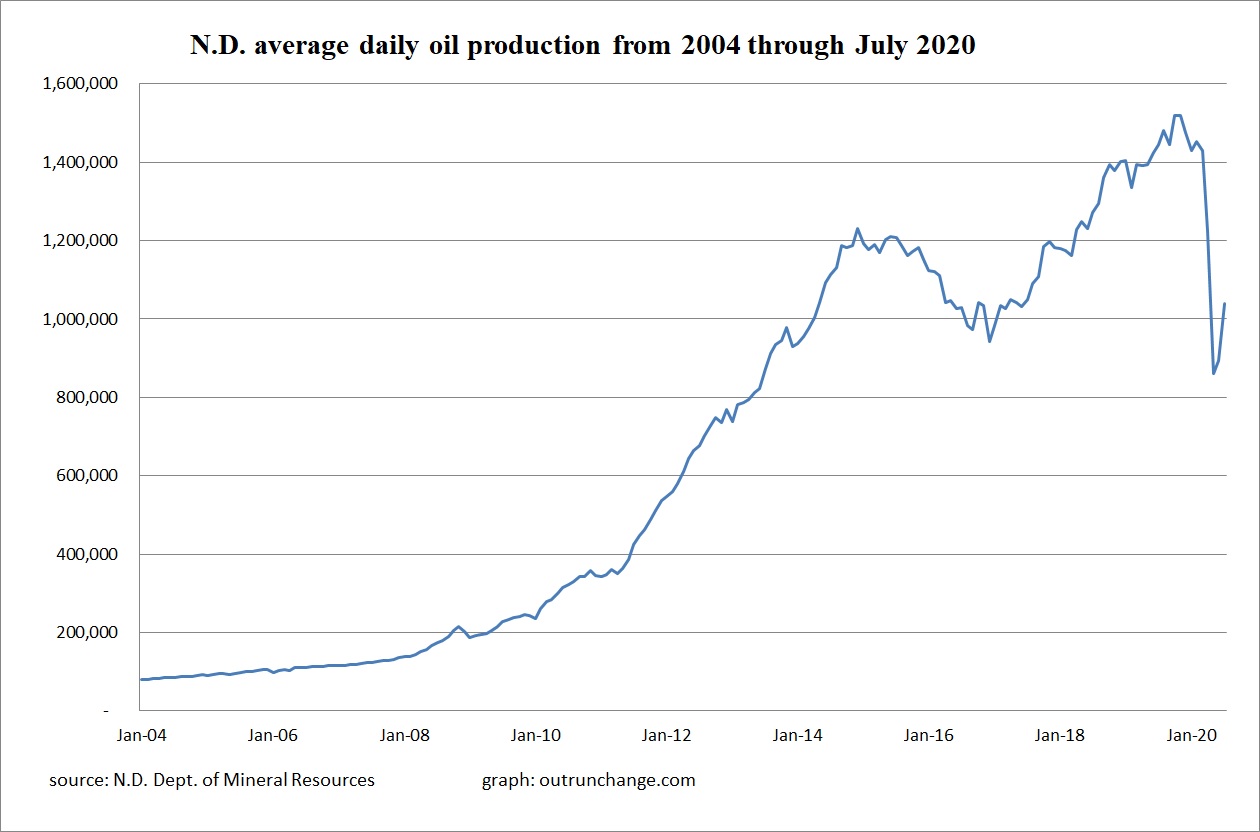
Oil production in North Dakota starting to recover in July 2020.

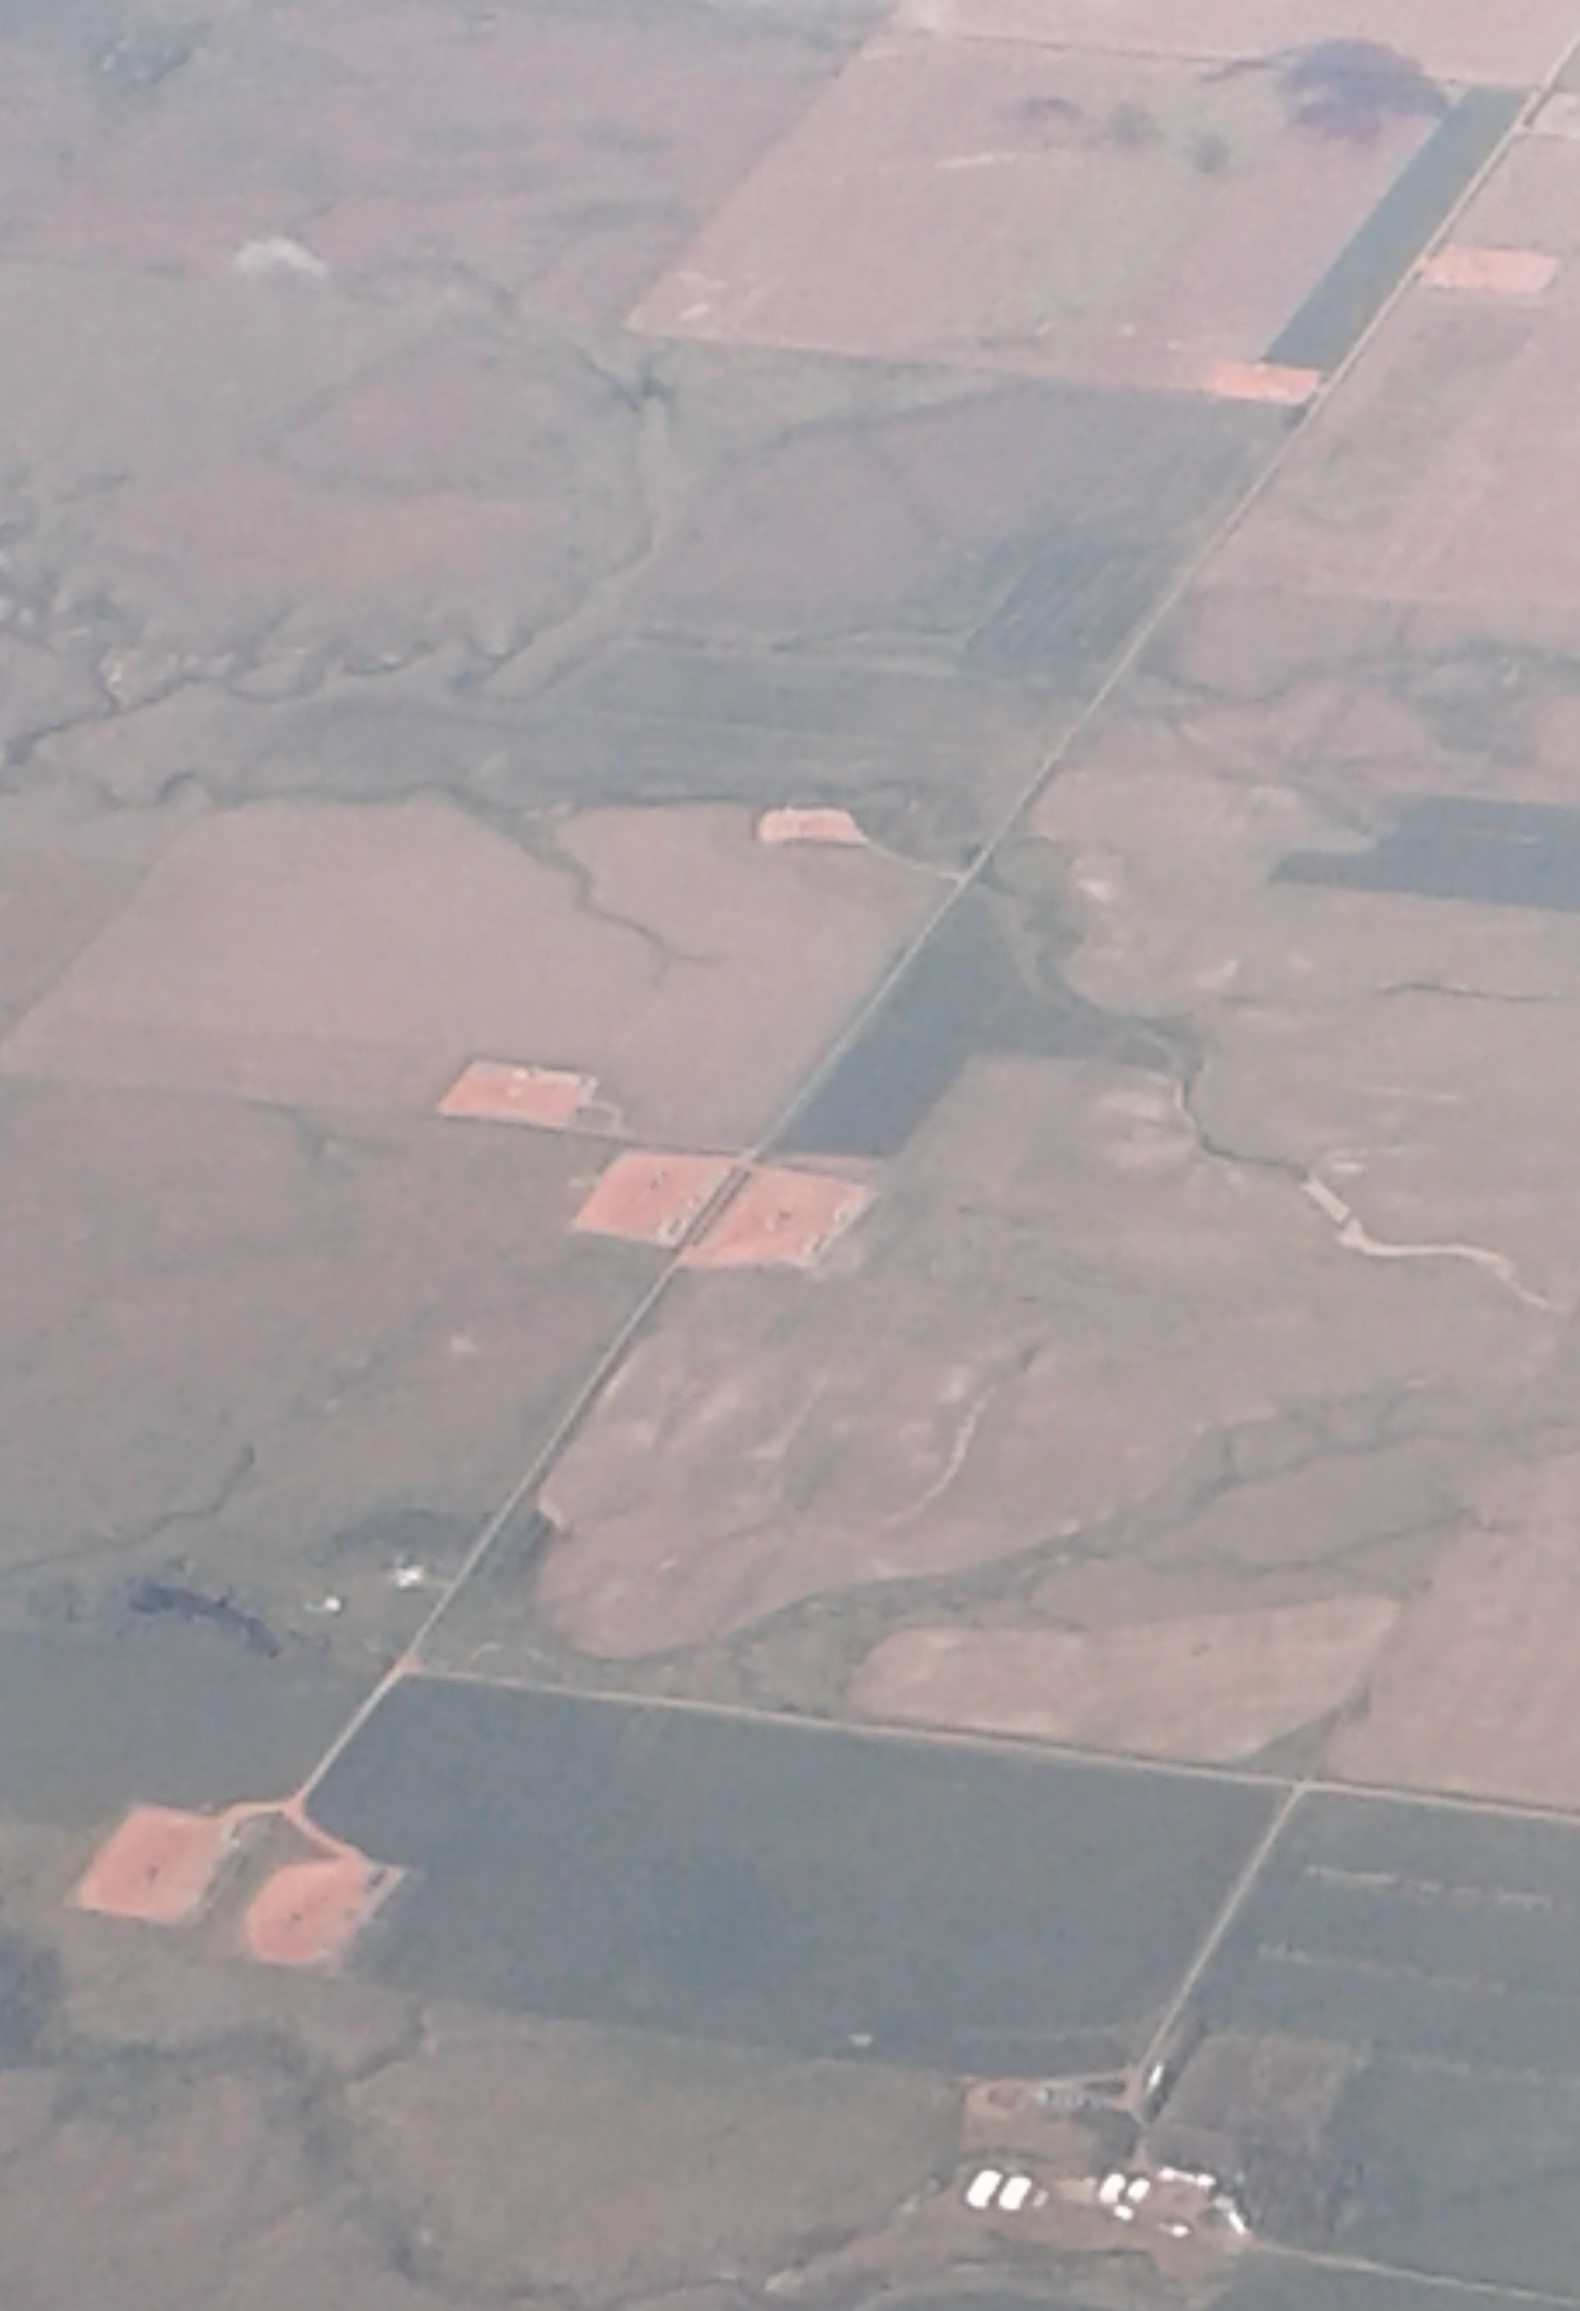
Each of the light brown spaces is a well pad. Photo by James Ulvog.

As seen in the following graph, crude oil production increased in July 2020. It is up 179,958 barrels of oil per day (bopd) over the low of 860,430 bopd in May. This is a drop of 478,644 bopd from the high point in November 2019.

Continue reading “Oil production in North Dakota starting to recover in July 2020.”

Additional comments on drop in oil production in May 2020.

Photo by James Ulvog.

Comments in the Bismarck Tribune and Williston Herald provide context on the drastic drop in oil production during May.

The Tribune was more dramatic in describing the drop.

Oil production in North Dakota “cratered” during the month, as described by the Bismarck Tribune on 7/17:  North Dakota shatters previous record oil drop as pandemic hits industry hard.

Notice the “shatters” description in the headline.

Impact of pandemic was to “tank” the production.

Director Helms referred to the drop as a “five alarm fire” for the industry.

Continue reading “Additional comments on drop in oil production in May 2020.”

Deeper look at the May 2020 drop in North Dakota oil production.

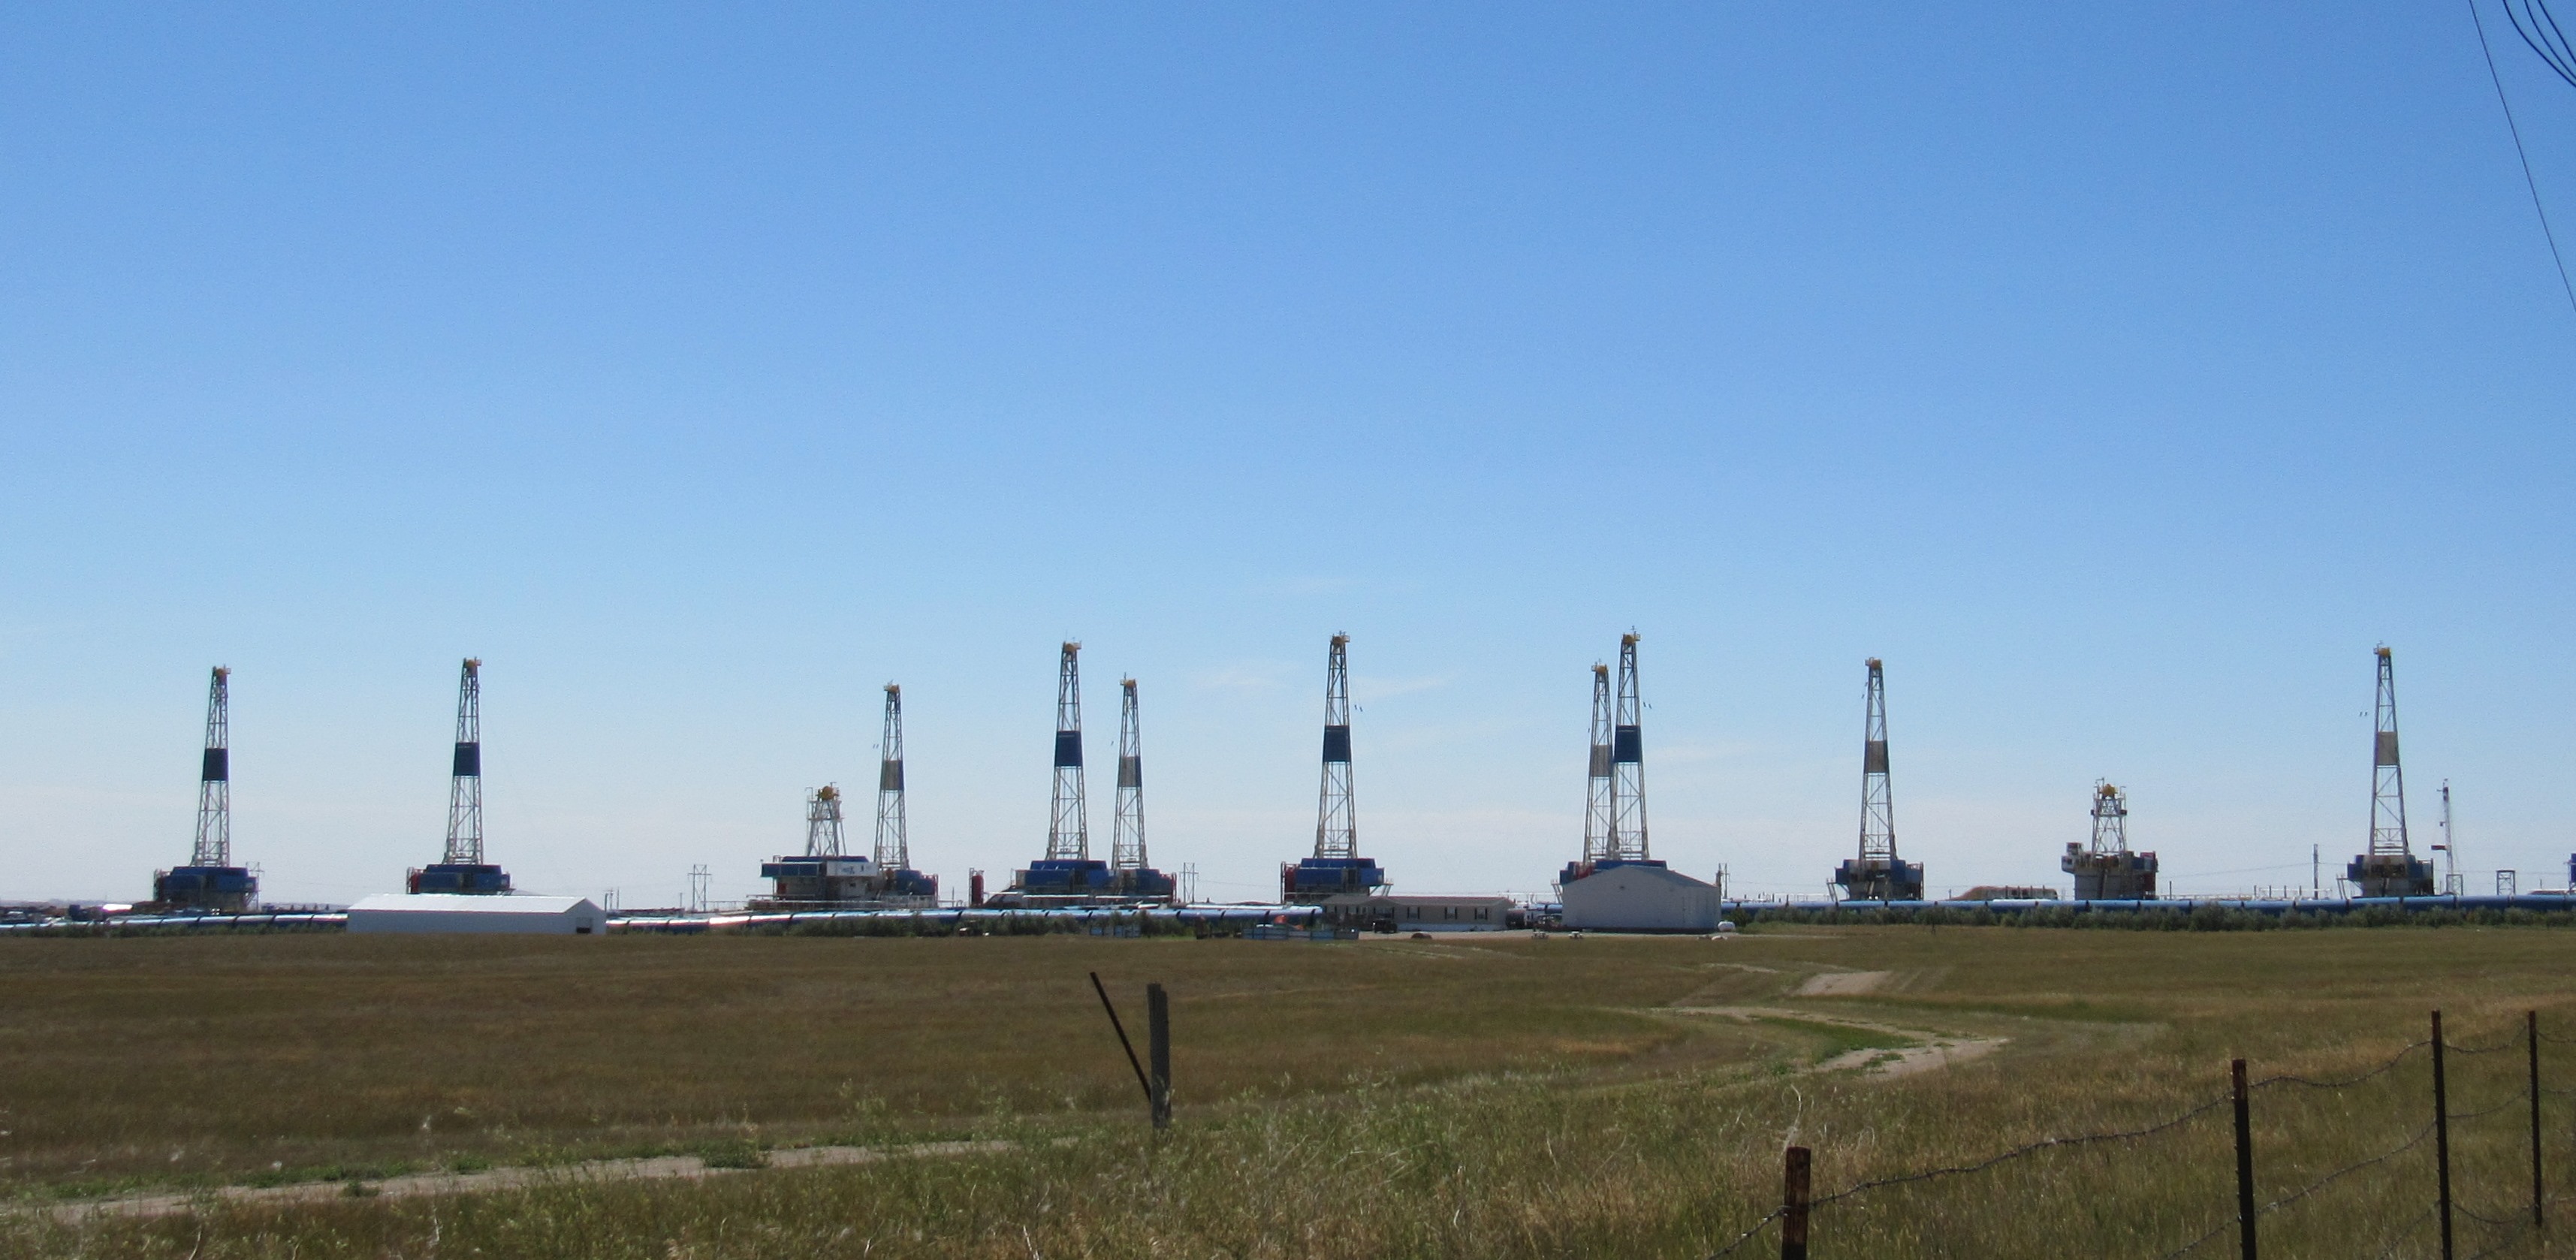
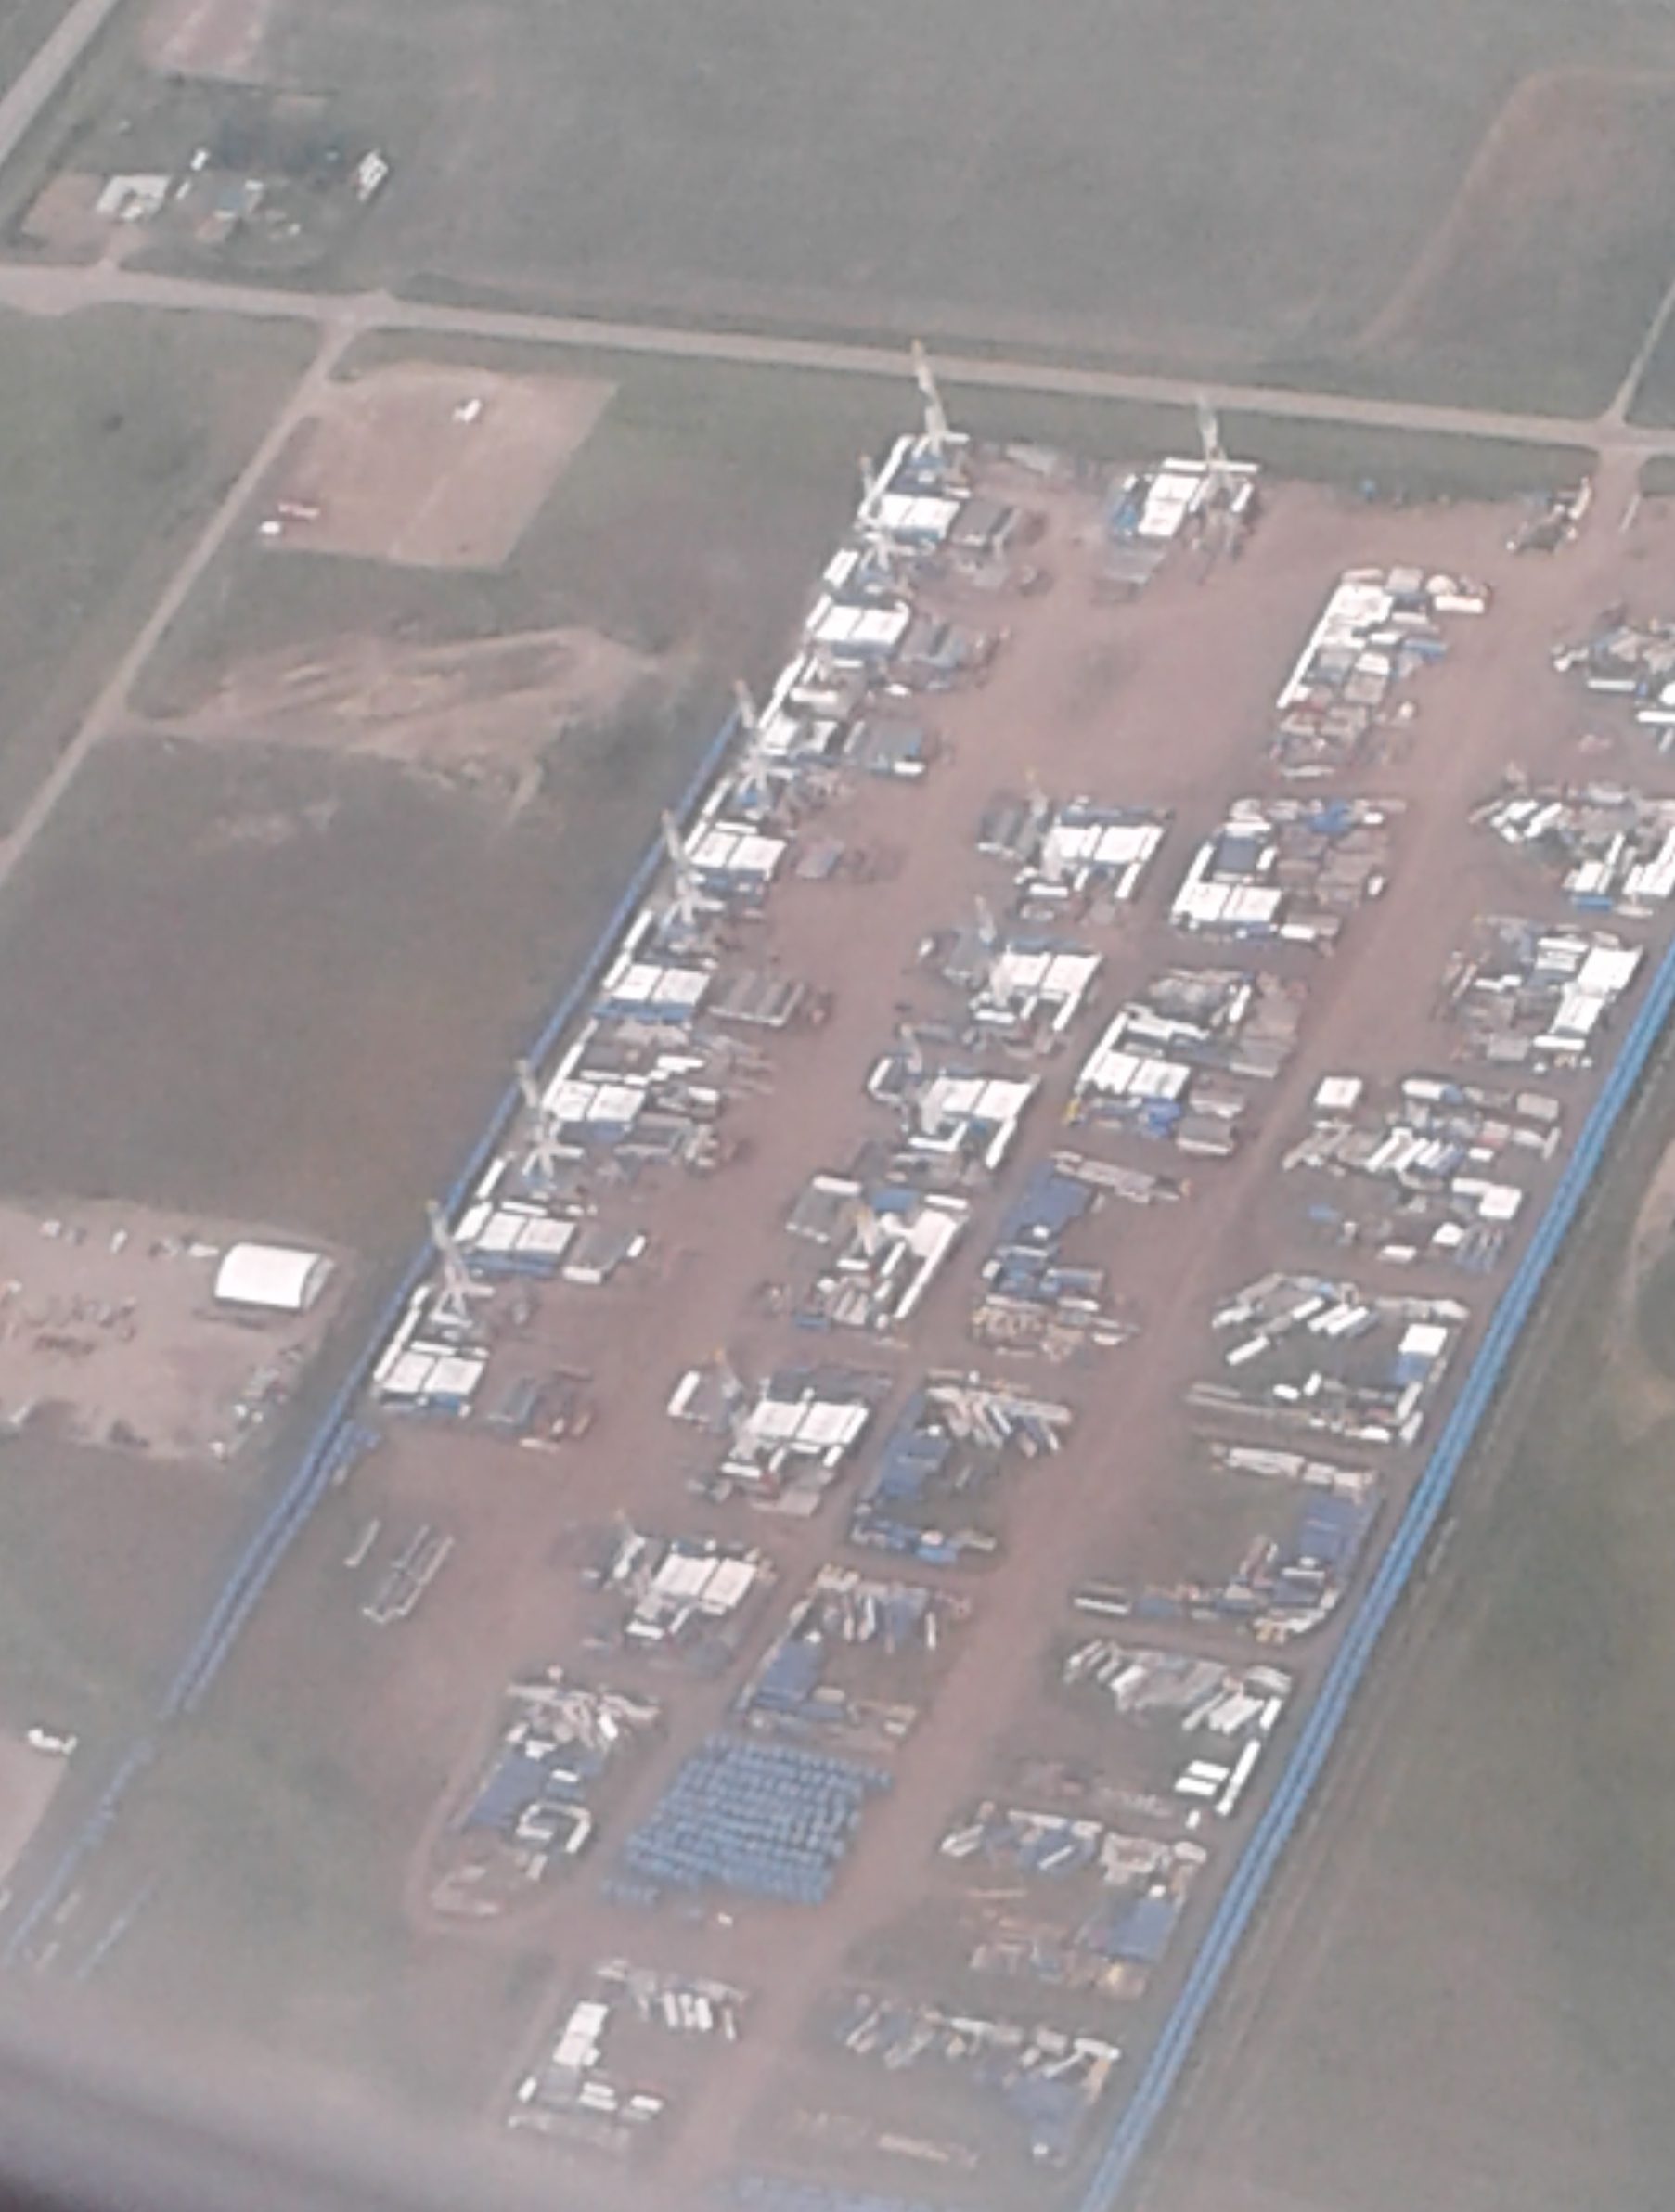
Idle drilling rigs parked to the west of Williston. Photo by James Ulvog.

Crude oil production in the state dropped to 858K bopd in May, which is a 362K bopd drop for the month and a 661K bopd drop since the record high of 1,519K bopd in November 2019.

Price of oil also collapsed, which means the value of production shrank.

Graphs of monthly production and prices can be seen in previous post.

Check out my calculation of the value of monthly production the combination of dropping output and dropping prices:


Just as a guess, I think production could be opened up almost as fast as it was cut back. More on that thought at the end of this post.

Activity counts

Continue reading “Deeper look at the May 2020 drop in North Dakota oil production.”

North Dakota oil production drops 362,624 barrels a day in May 2020, down 43% from the November 2019 record high.

With a 45 day lag in reporting to allow data submission and collation, the production data for crude oil during May is now available for North Dakota.

The combined shocks of reduced demand for the pandemic and flooding the market by Saudi Arabia collapsed prices which then collapsed production.  A glut of oil jammed the storage capacity for a while which further drove down the prices available to producers in North Dakota.

The impact on volume and value of production is staggering.

The graphs of production in this post demonstrate how rapidly a massive industry, like oil production across an entire state, can respond to price signals in a capitalist economy. That part is amazing to see.

May production data

Crude oil production in the state dropped to 858,395 bopd (preliminary) in May. This is down 362,624 bopd from the revised April level of 1,221,019 bopd. The April production was down 209,353 bopd from March.

Continue reading “North Dakota oil production drops 362,624 barrels a day in May 2020, down 43% from the November 2019 record high.”

Oil production dropping in North Dakota; not yet visible in March data.

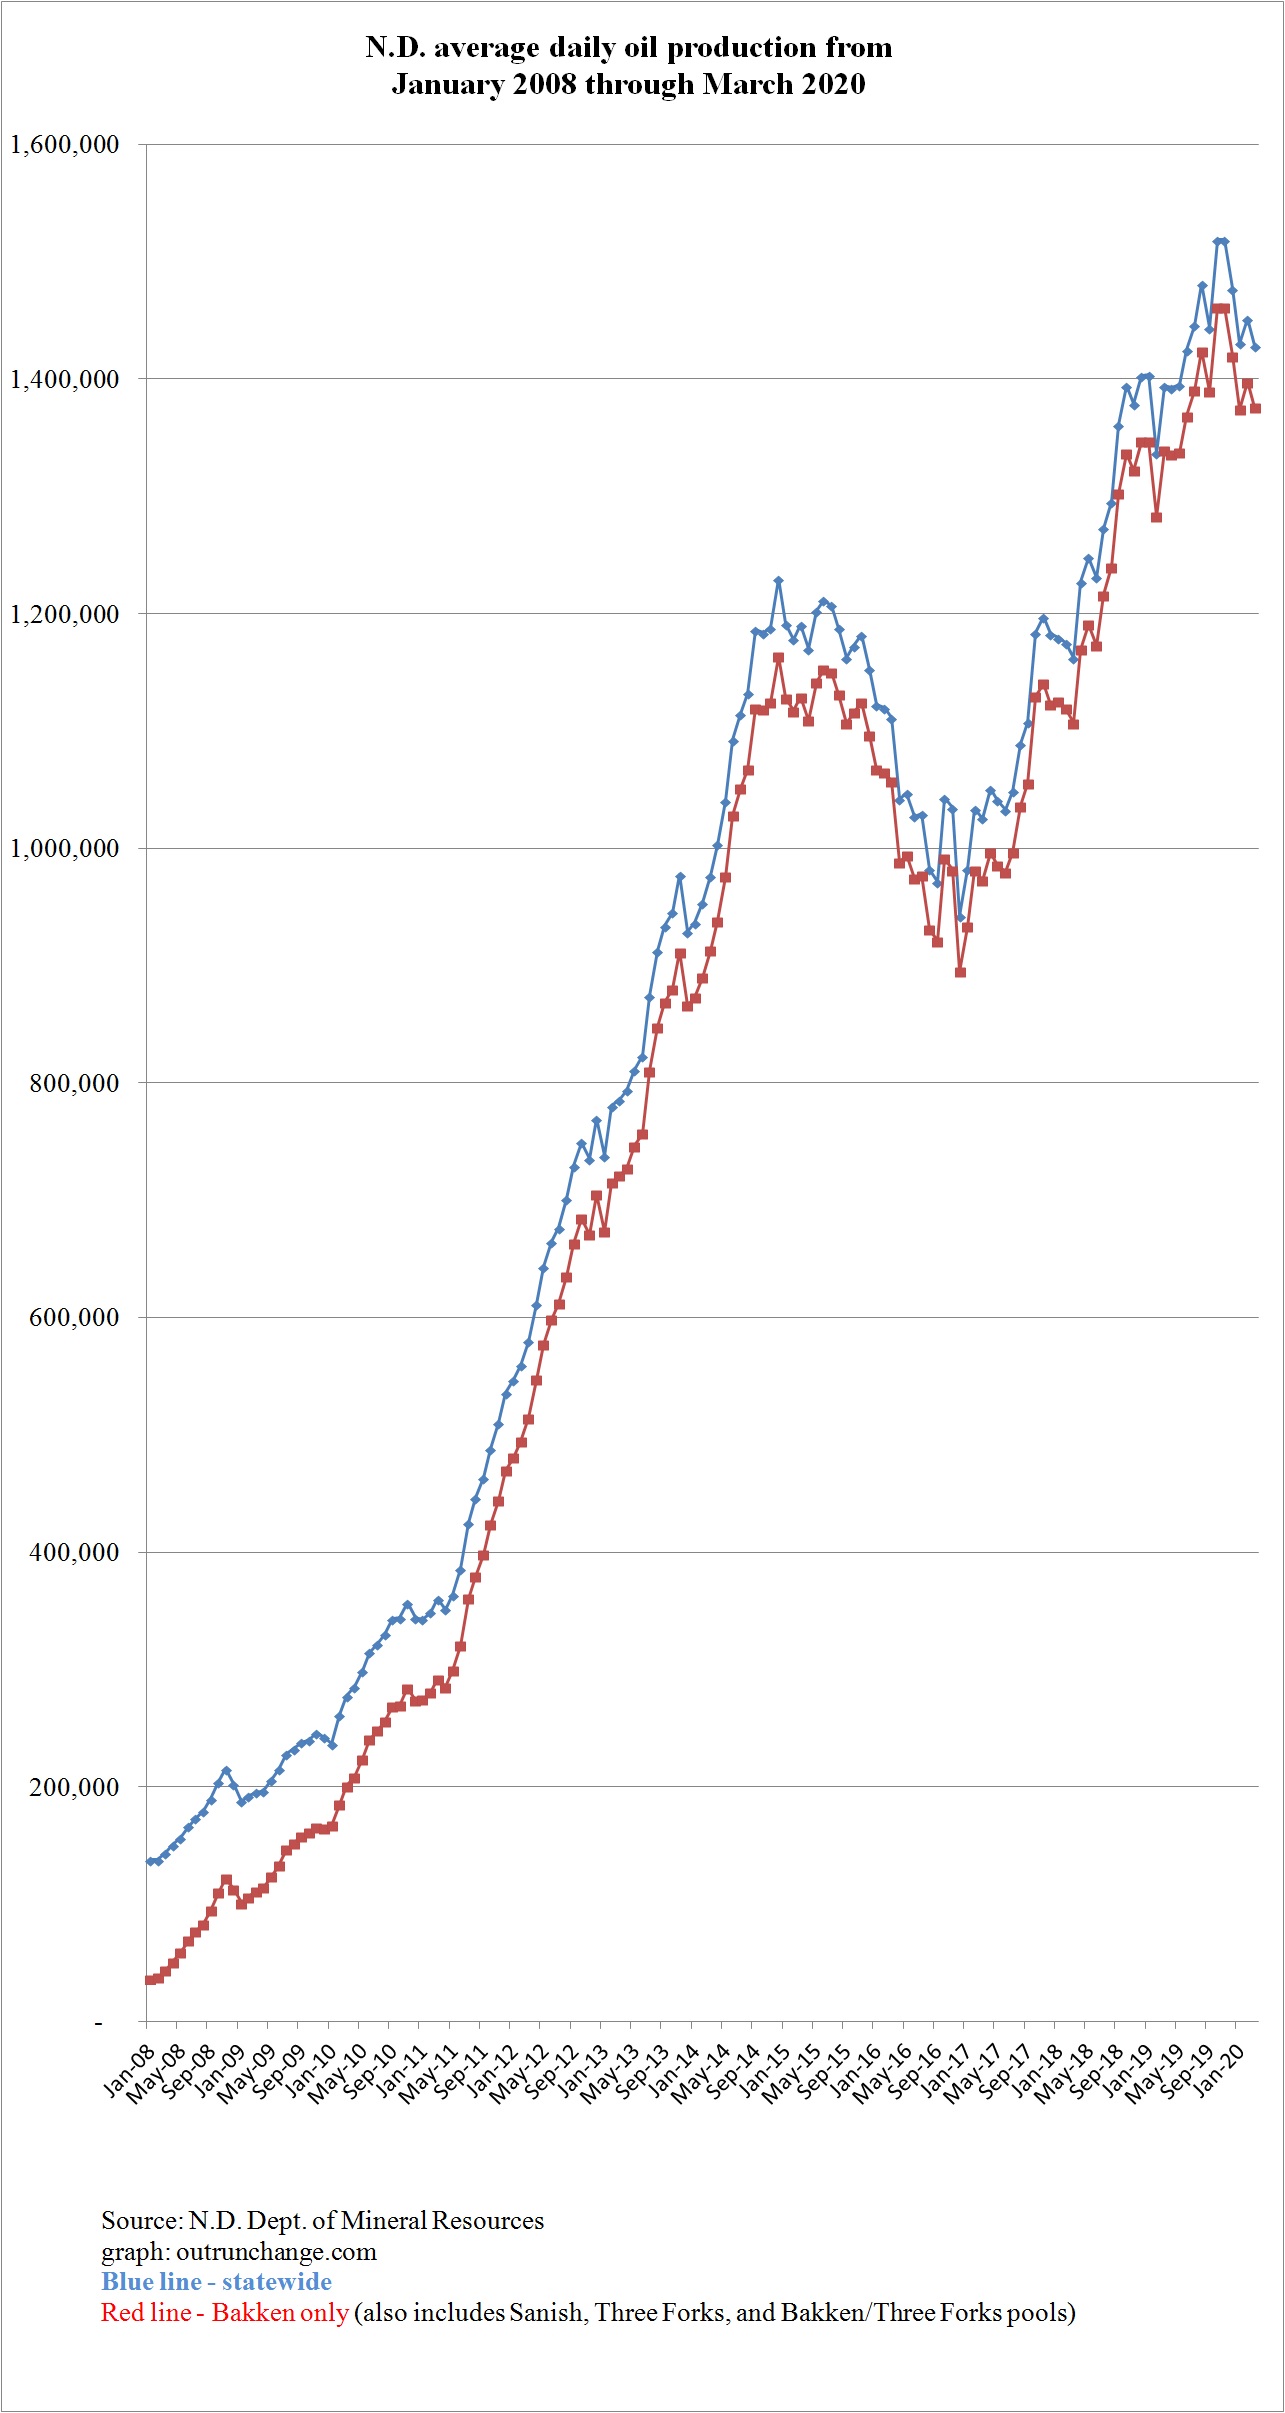
Production data in North Dakota is routinely released on about the 15th of each month reflecting data for the second previous month.  So the info just released on May 15, 2020 reports the March 2020 activity.

The radical drop in price due to the demand shock and supply shock will show up in production data for April, expected to be released about 6/15/20.

5/15/20 – Williston Herald – Helms: North Dakota crude has probably fallen below 1 million barrels, but March figures don’t yet reflect it – The head regulator, Lynn Helms, thinks that production in the state is currently below 1 million barrels a day. The May data won’t be released until July.

Continue reading “Oil production dropping in North Dakota; not yet visible in March data.”

Magic of the price signal to change production levels.

Fourteen wells on one pad, located on the southeast side of Williston, N.D. Photo by James Ulvog.

The double black swan of COVID-19 pandemic from the demand side and Saudi Arabia flooding the market from the supply side is creating a sales problem and storage problem for the oil industry.

Regulators in Texas are thinking about about ordering a pro-rate reduction in production. In other words, they are considering giving each producer an order on how much to cut.

North Dakota has no such plans.

North Dakota is planning to rely on capitalism to rapidly adjust production.

Continue reading “Magic of the price signal to change production levels.”