Night sky in Williston, N.D. Long exposure photo by Joe U. Look at all the stars.
In February 2020, crude oil production in North Dakota averaged 1,451,029 bopd (preliminary), up 20,518 bopd from 1,430,511 bopd (revised) in January. This is the 4th highest level of output, behind the high water mark of 1,519,032 bopd in November.
Production is going to drop rapidly. Drop will be at least 20% of current production. I’ll make a not-so-wild guess decline will be a quarter or more (>25%).
Prices have collapsed due to a double black swan. The COVID-19 pandemic has caused a demand side shock.
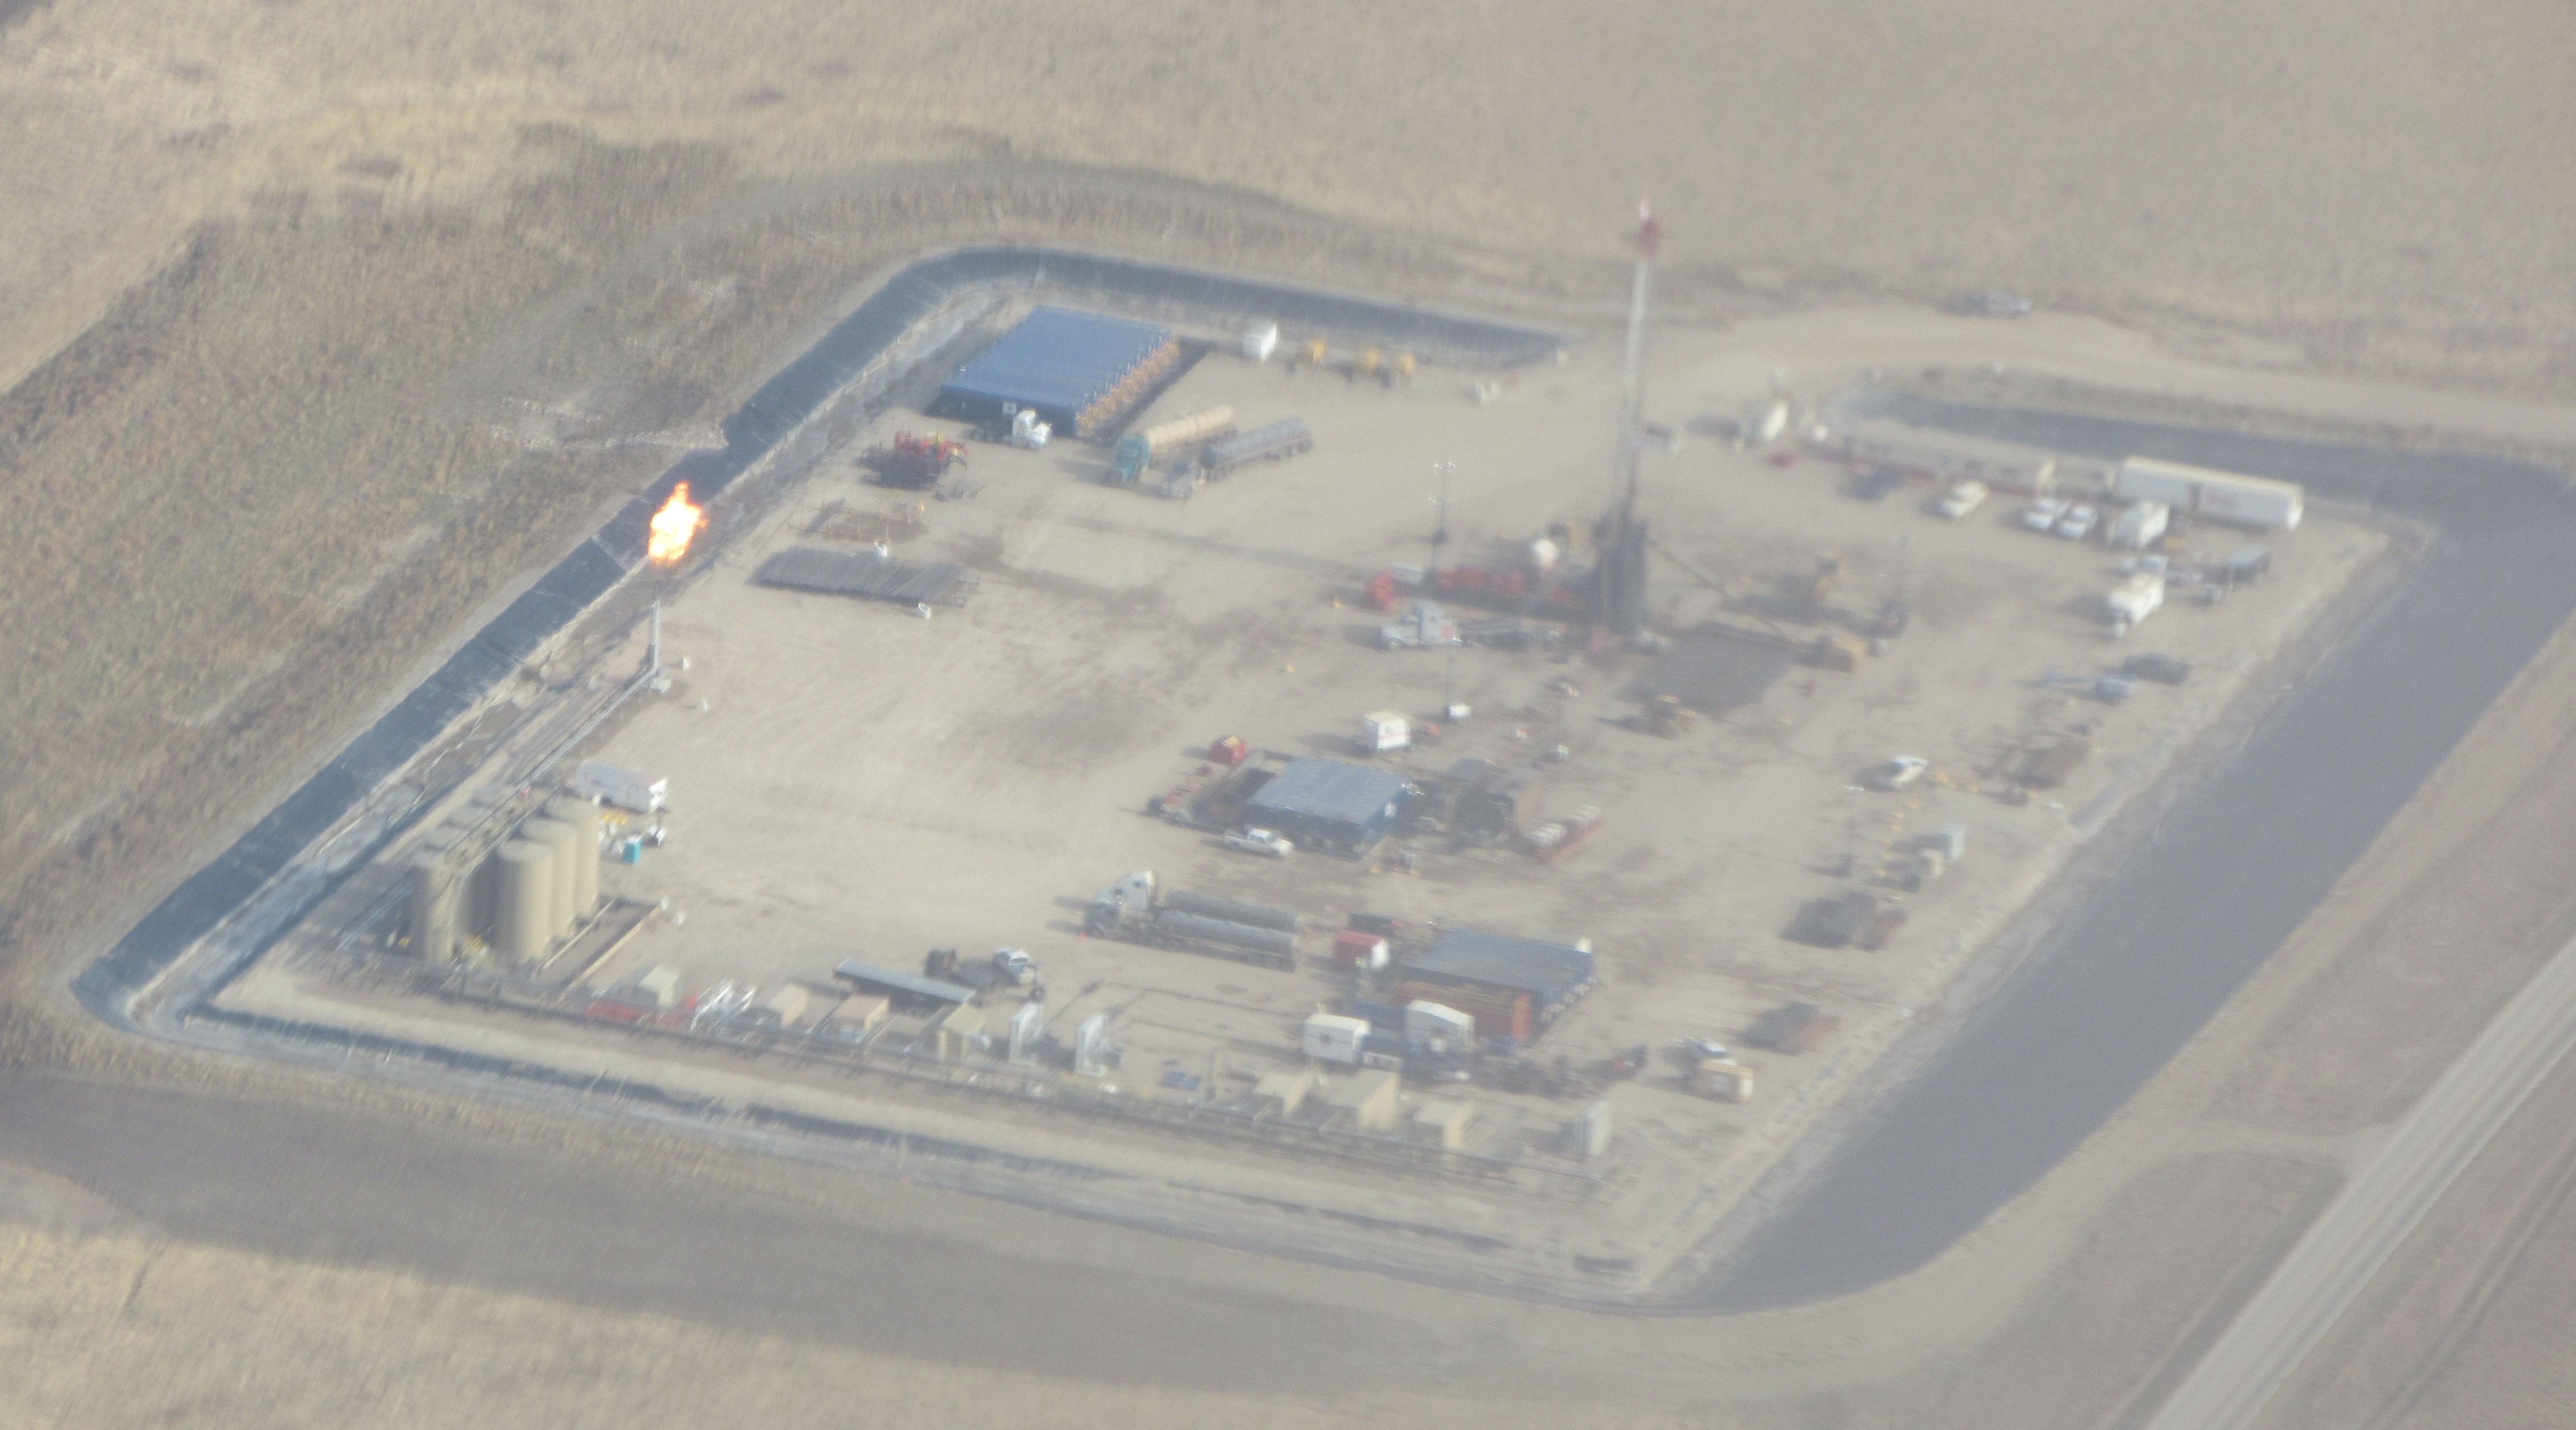
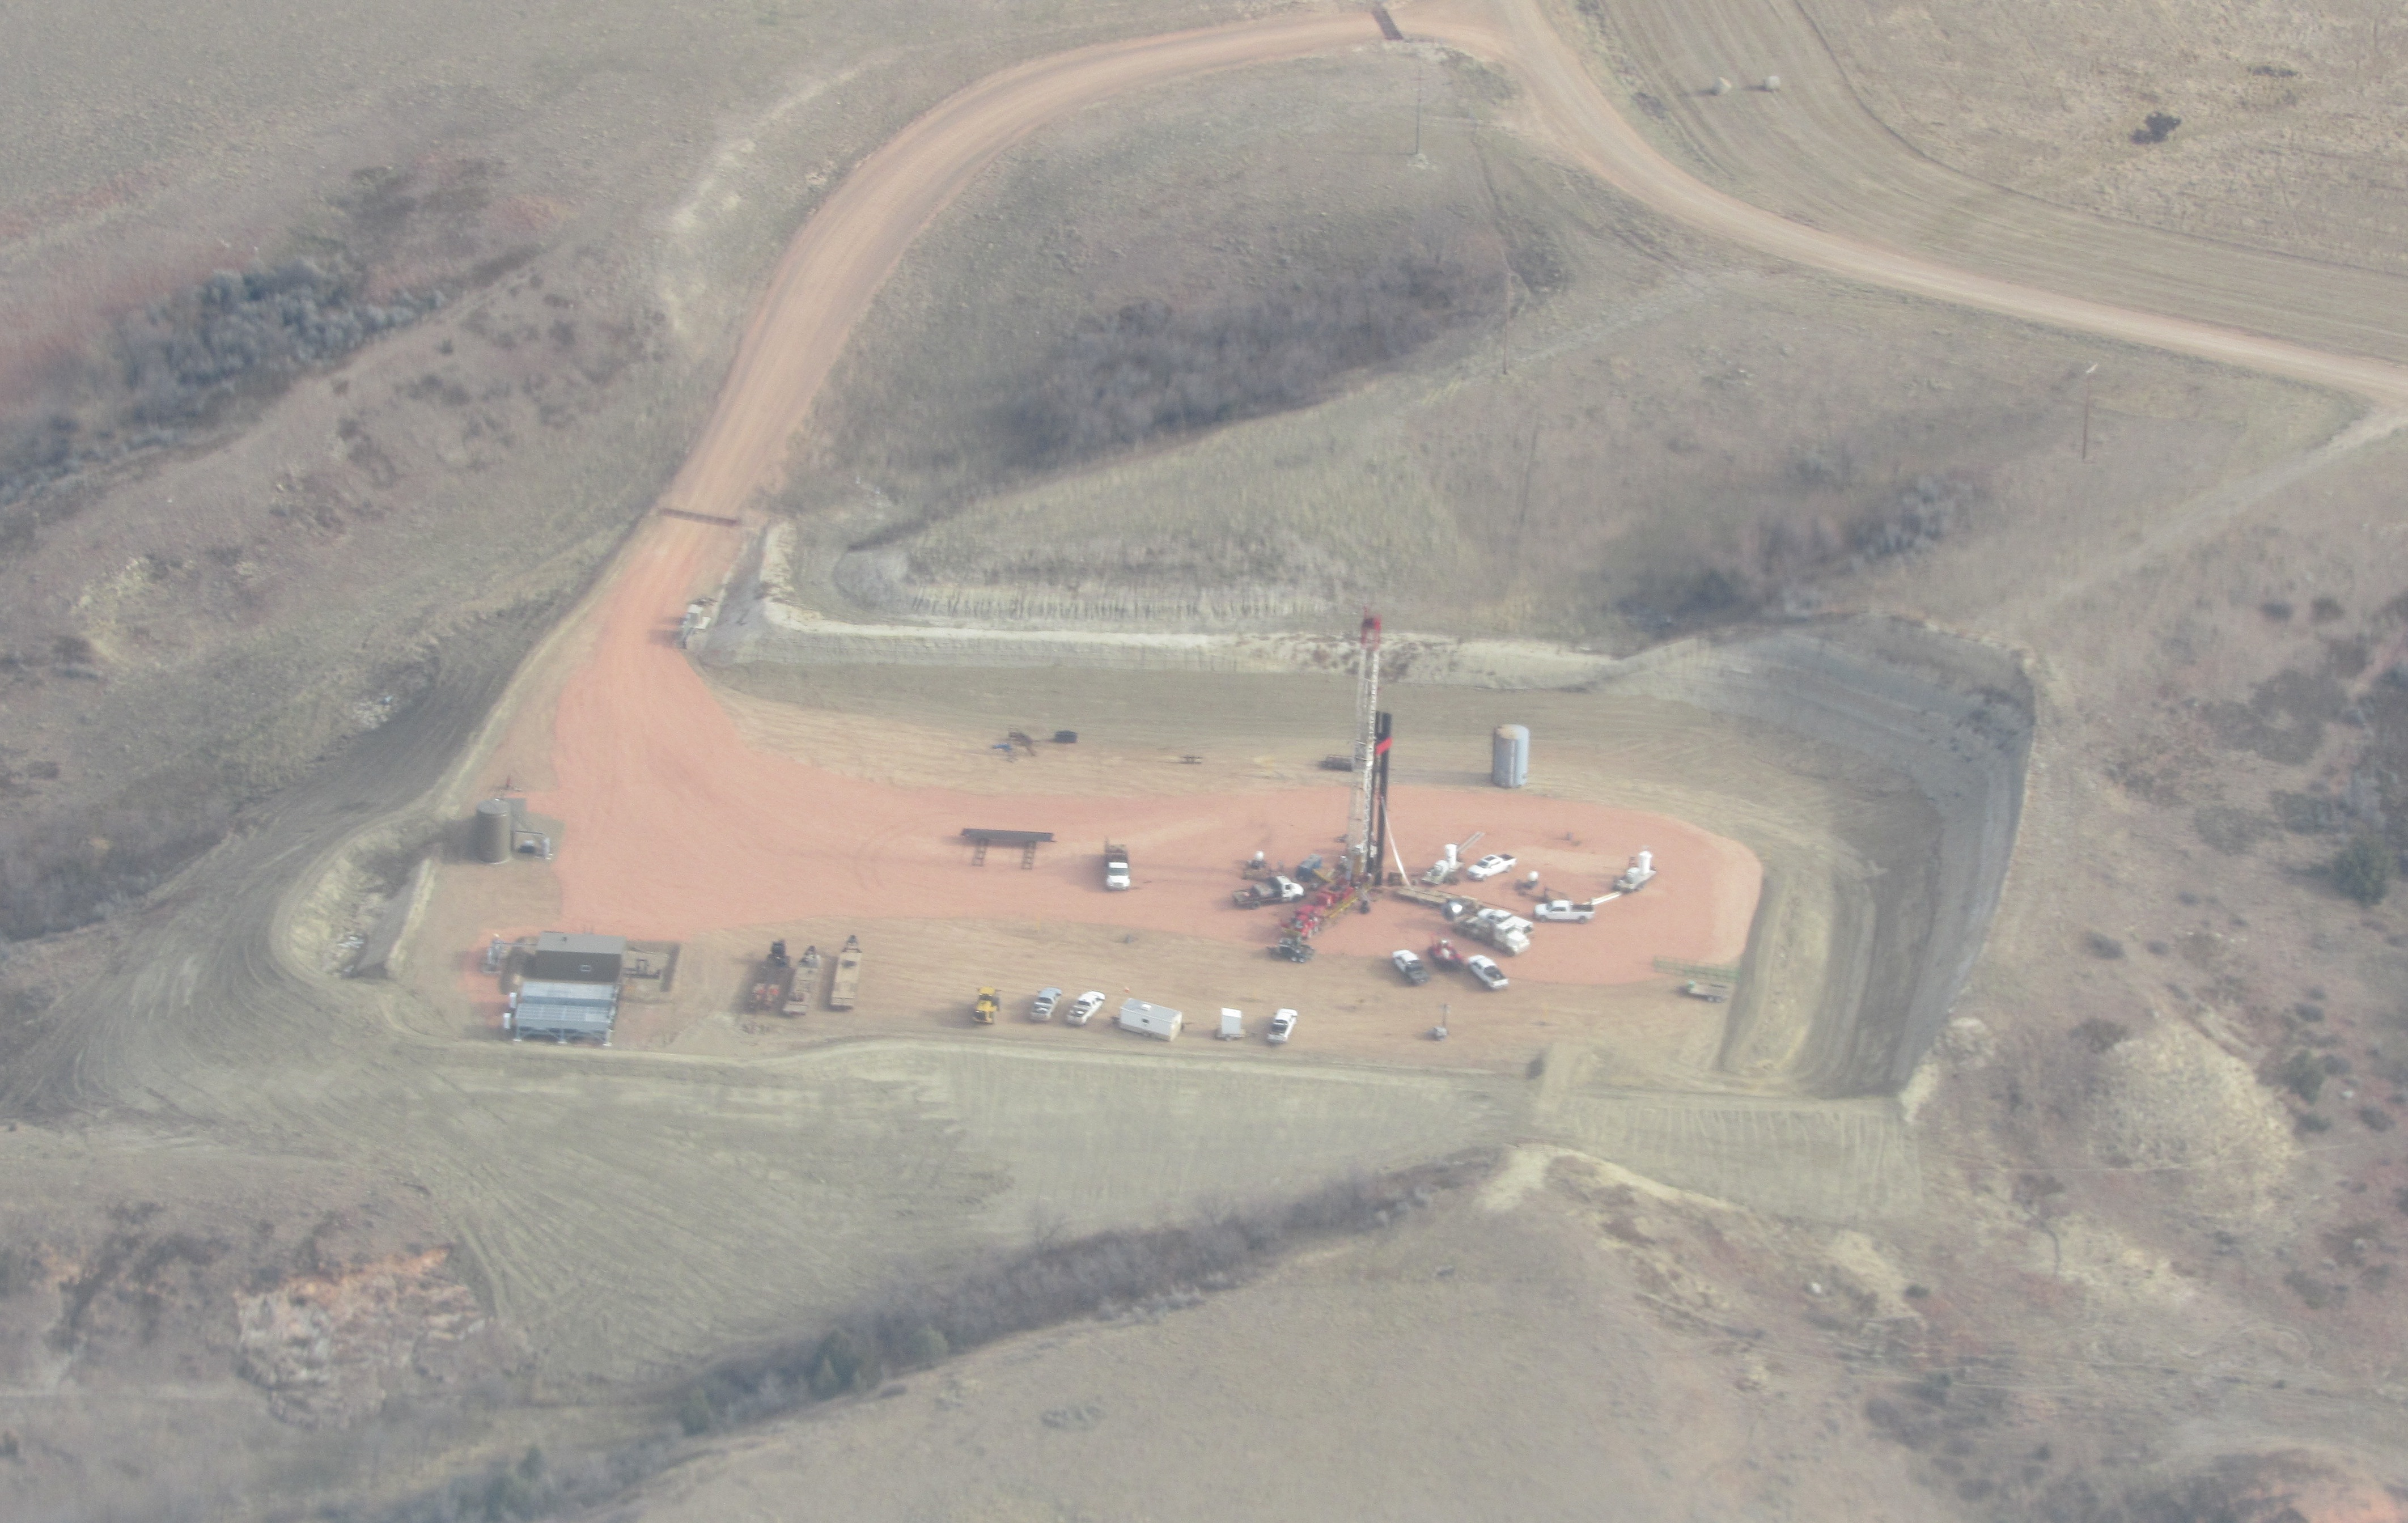
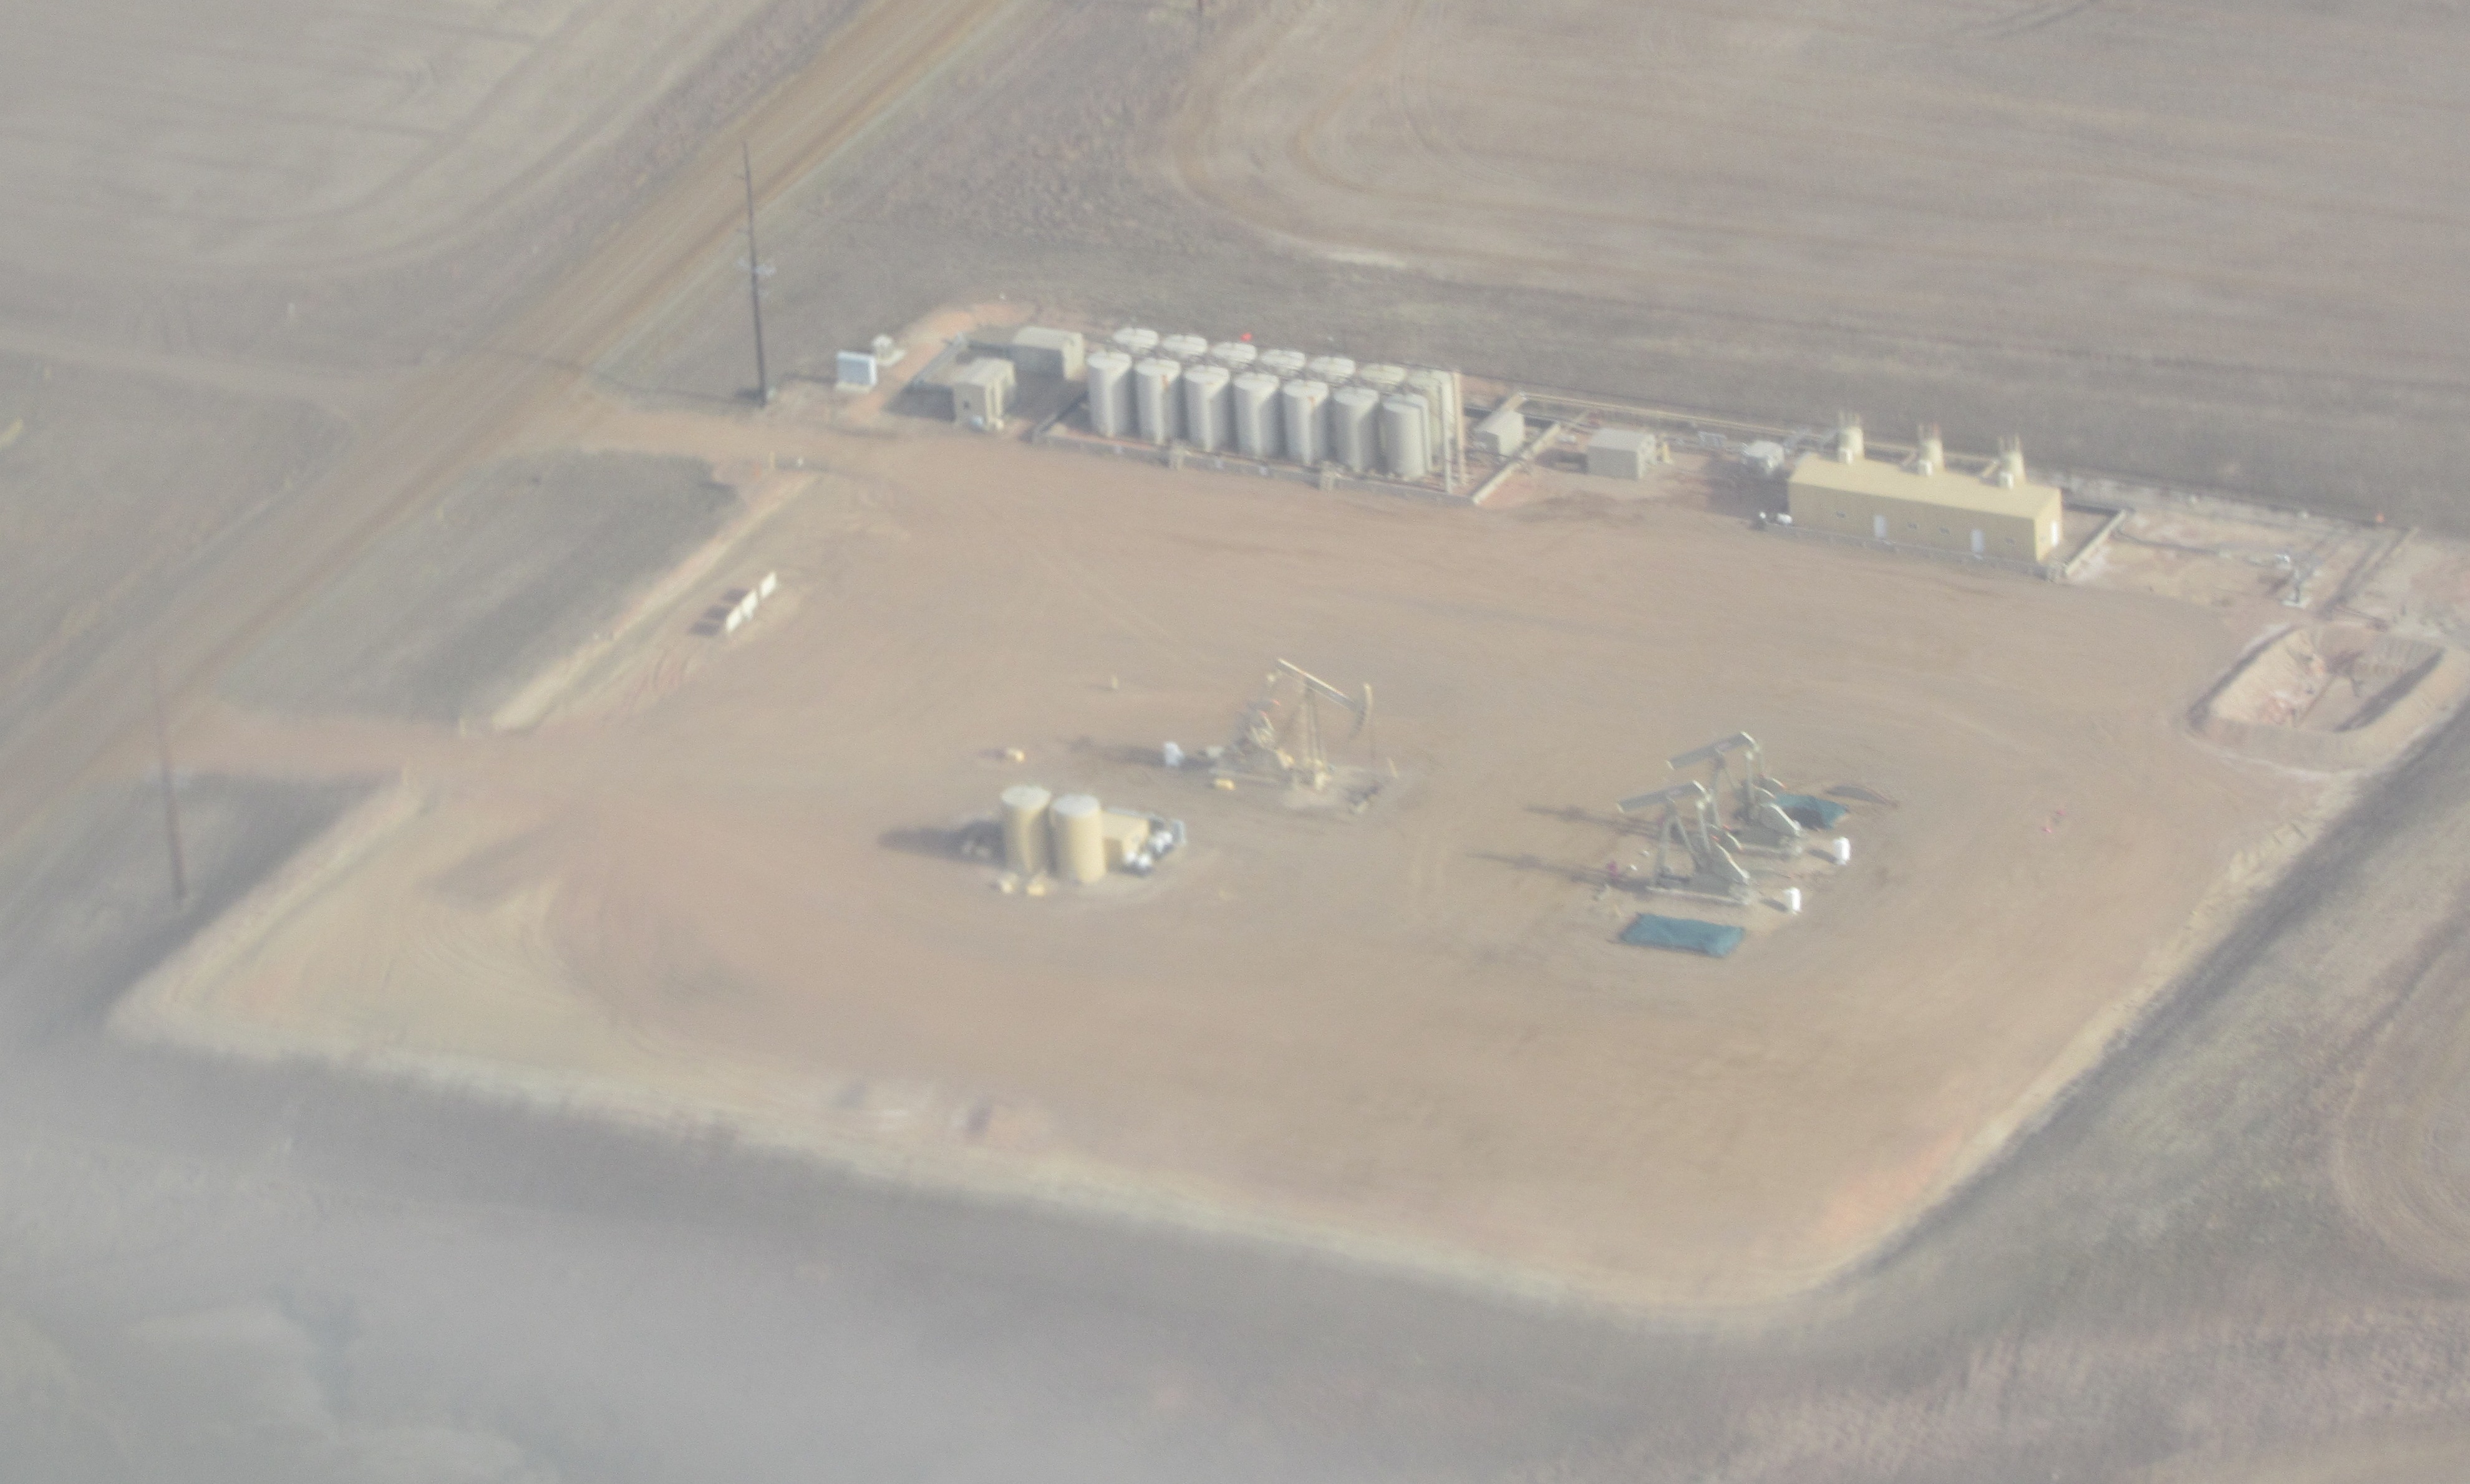
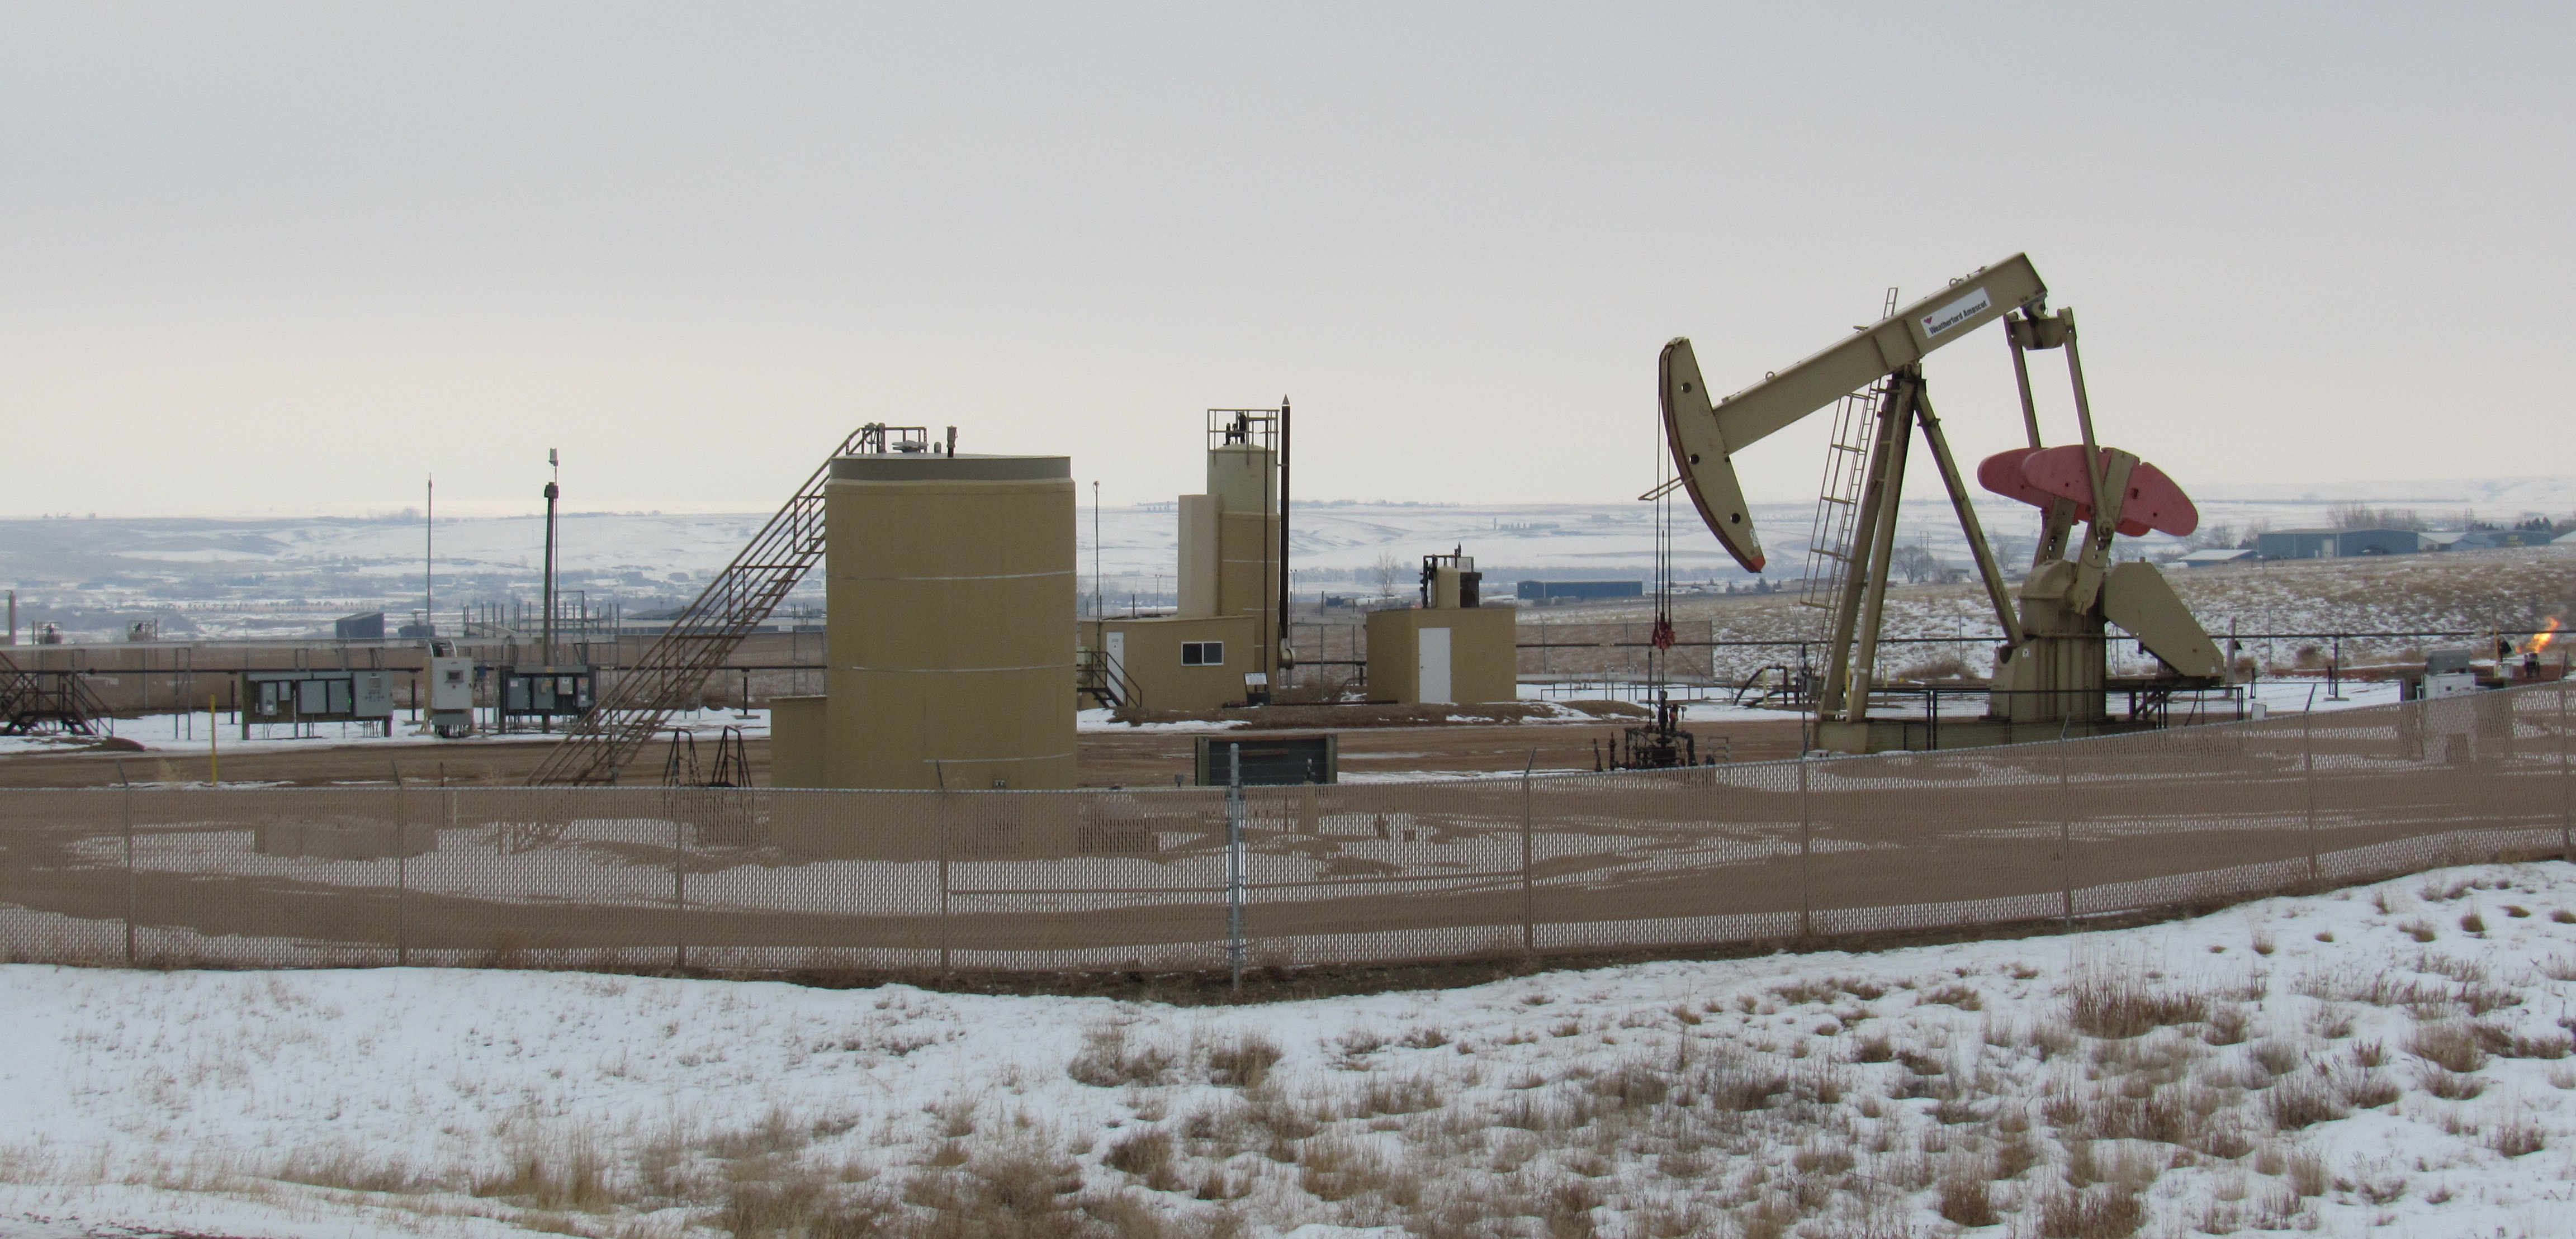
Workover rig in place. Flaring of gas visible. Lots and lots of room for more wells. Photo by James Ulvog.
Uh oh.
Production in North Dakota dropped in January, which is typical. Look at the production chart and you can pick out each of the winters because production usually falls off.
However, the price has fallen through the floor, courtesy of Saudi Arabia and Russia kicking off a price war and declaring they will flood the market with increased production.
Crude oil prices dropped in February and have continued in free fall during March. Prices on 3/17/20 per the Director’s Cut report are all the way down to $18.50 for North Dakota light sweet and $23.60 for the North Dakota market estimate.
Production in January 2020 dropped to 1,429,515 bopd (preliminary), off 47,262 bopd from January (revised) and down 89,515 bopd from December’s record high.
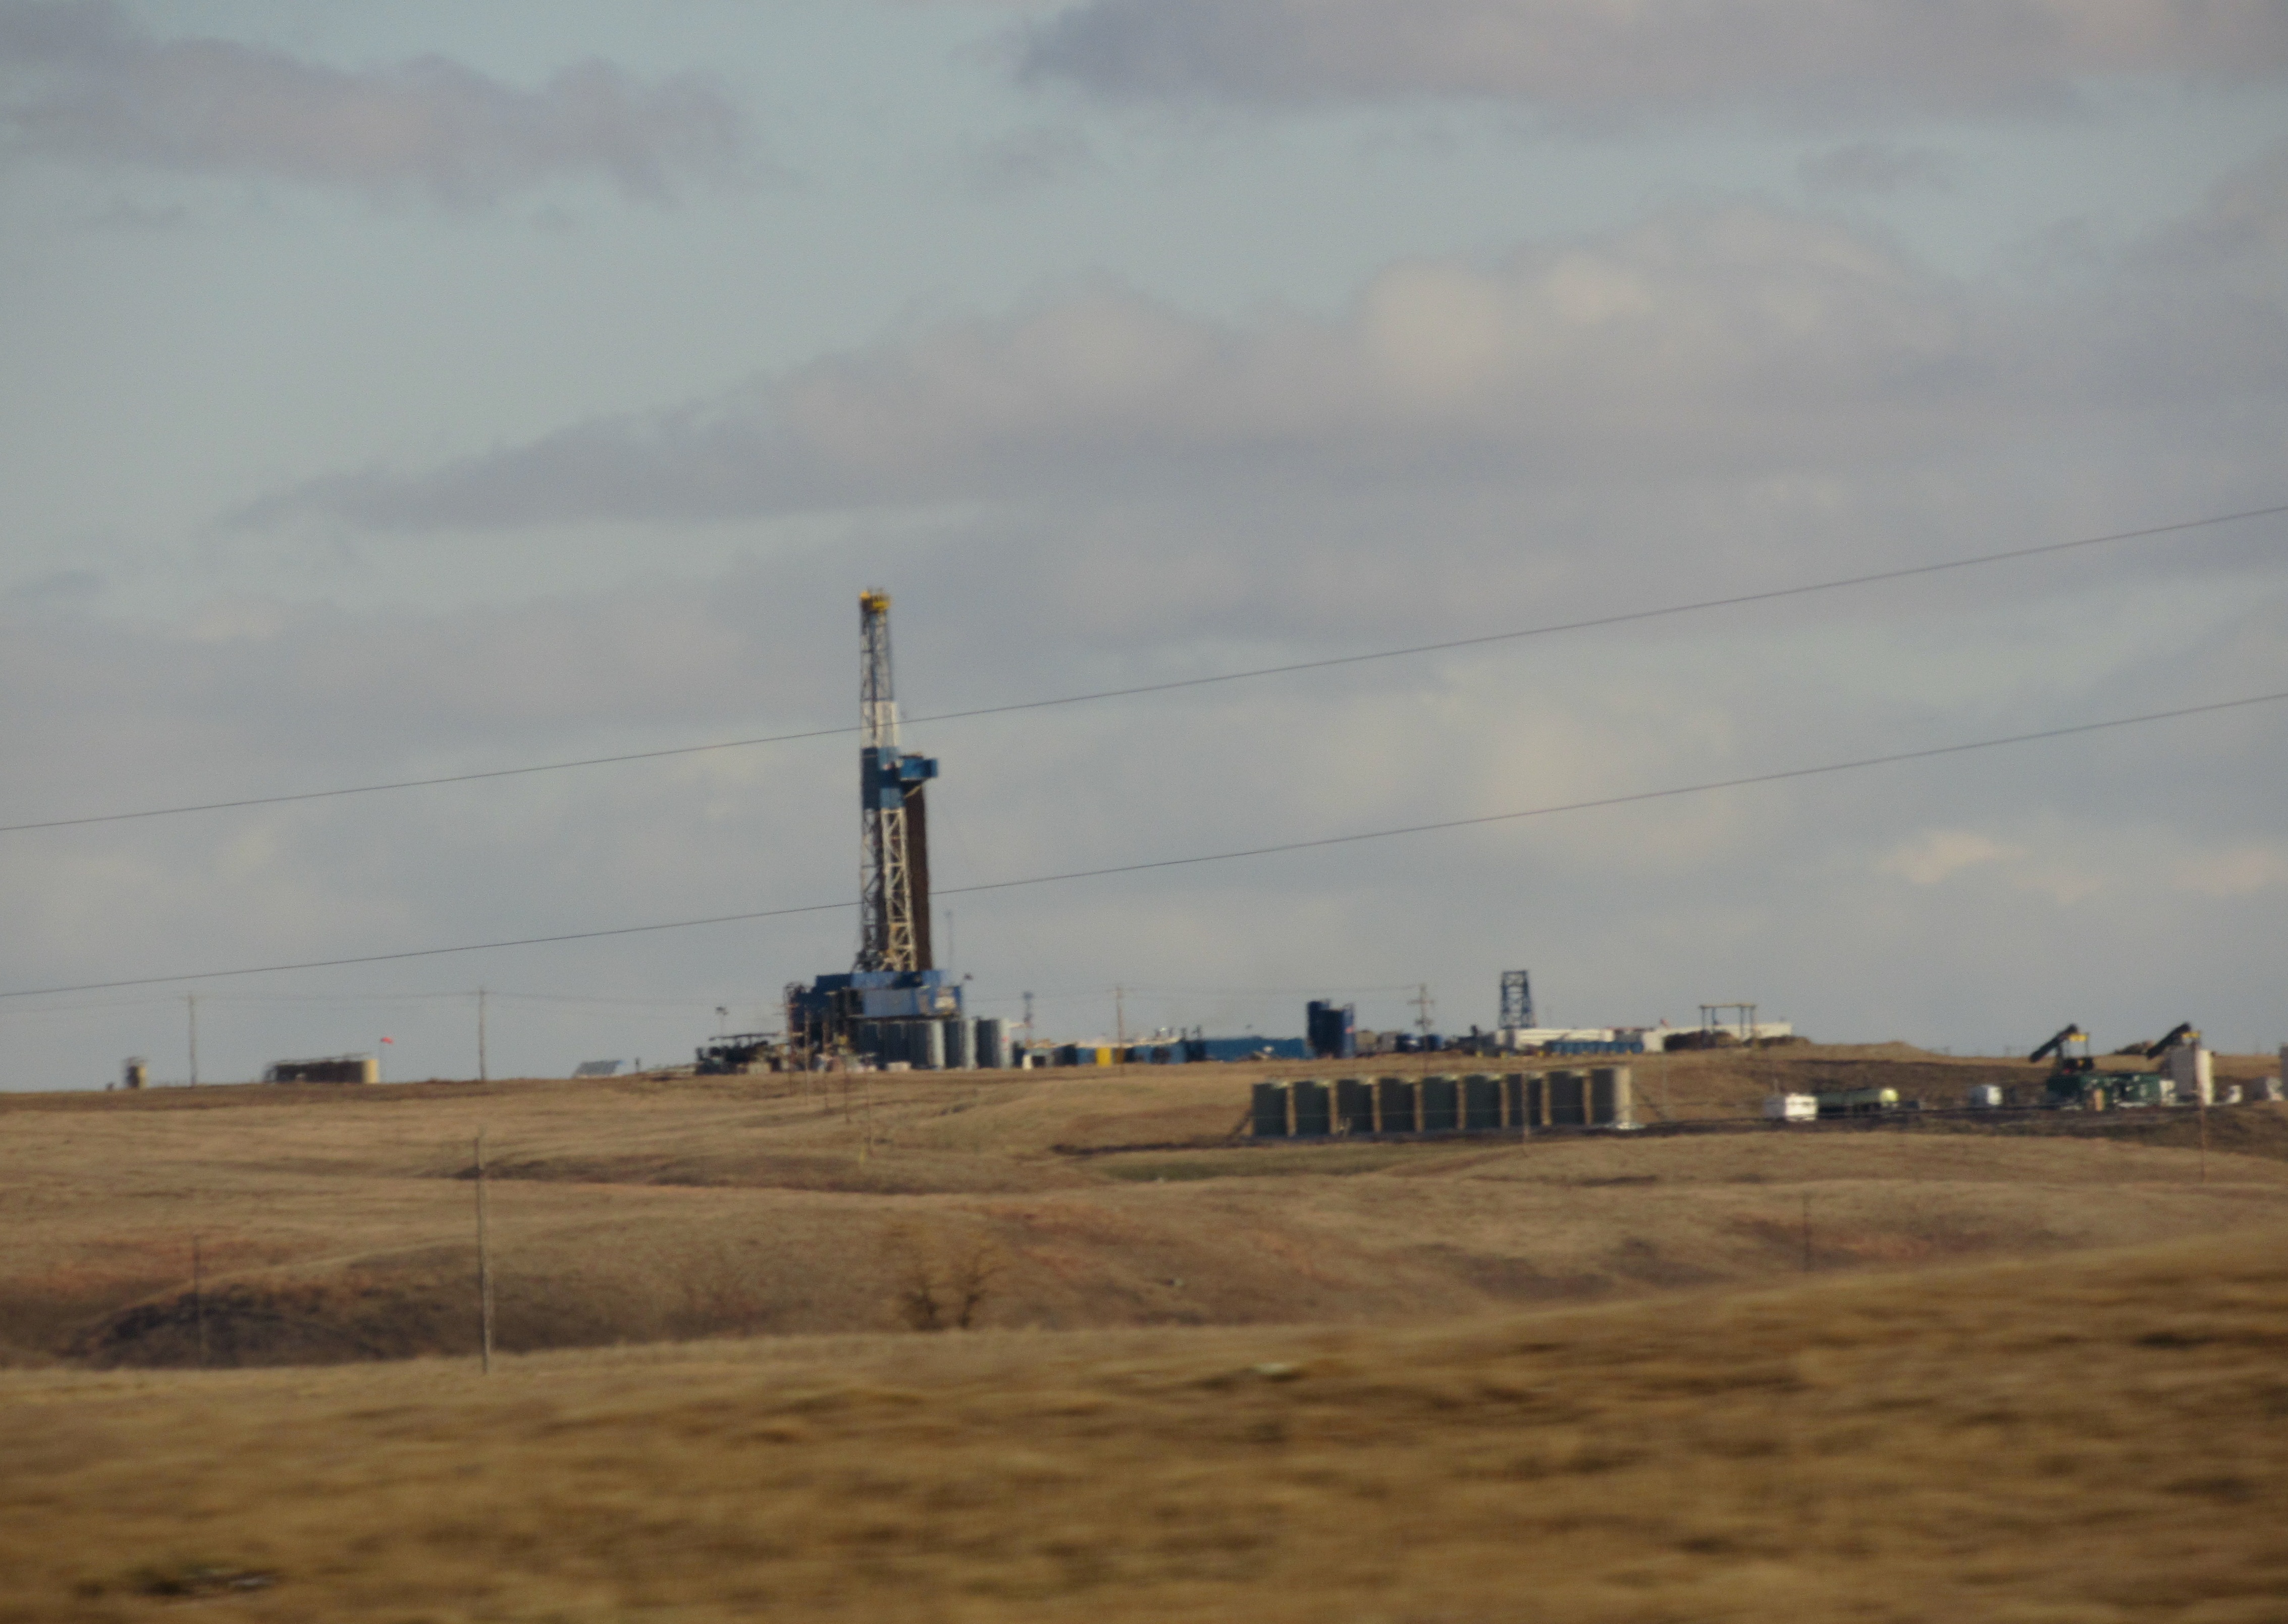
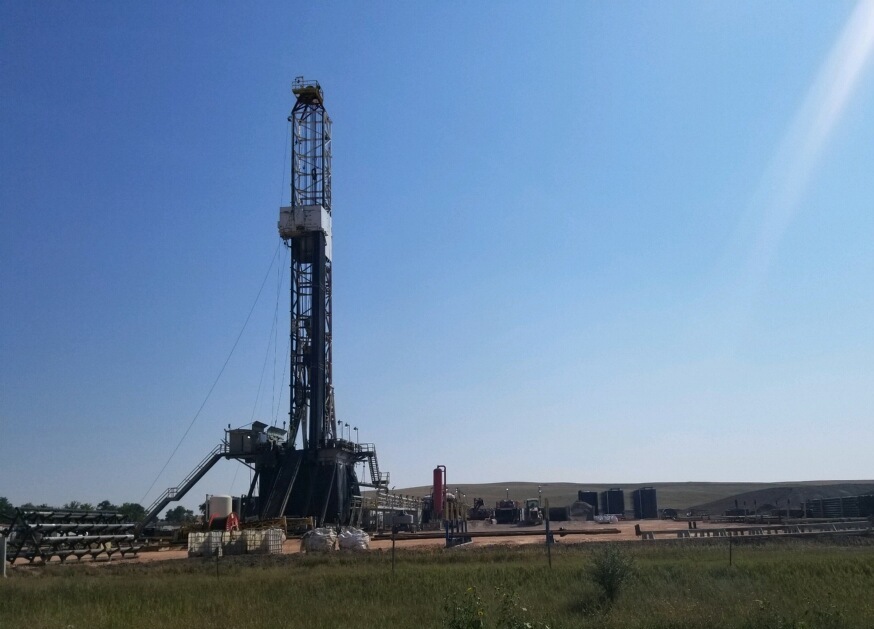
Drilling rig in North Dakota, between WIllison and Crosby. Photo by James Ulvog.
Saudi Arabia and Russia had a falling-out over the weekend about controlling production levels and prices. As a result Saudi Arabia is going to cut prices and increase production.
They have announced they will cut prices by somewhere between $6 and $8 a barrel in April, depending on destination.
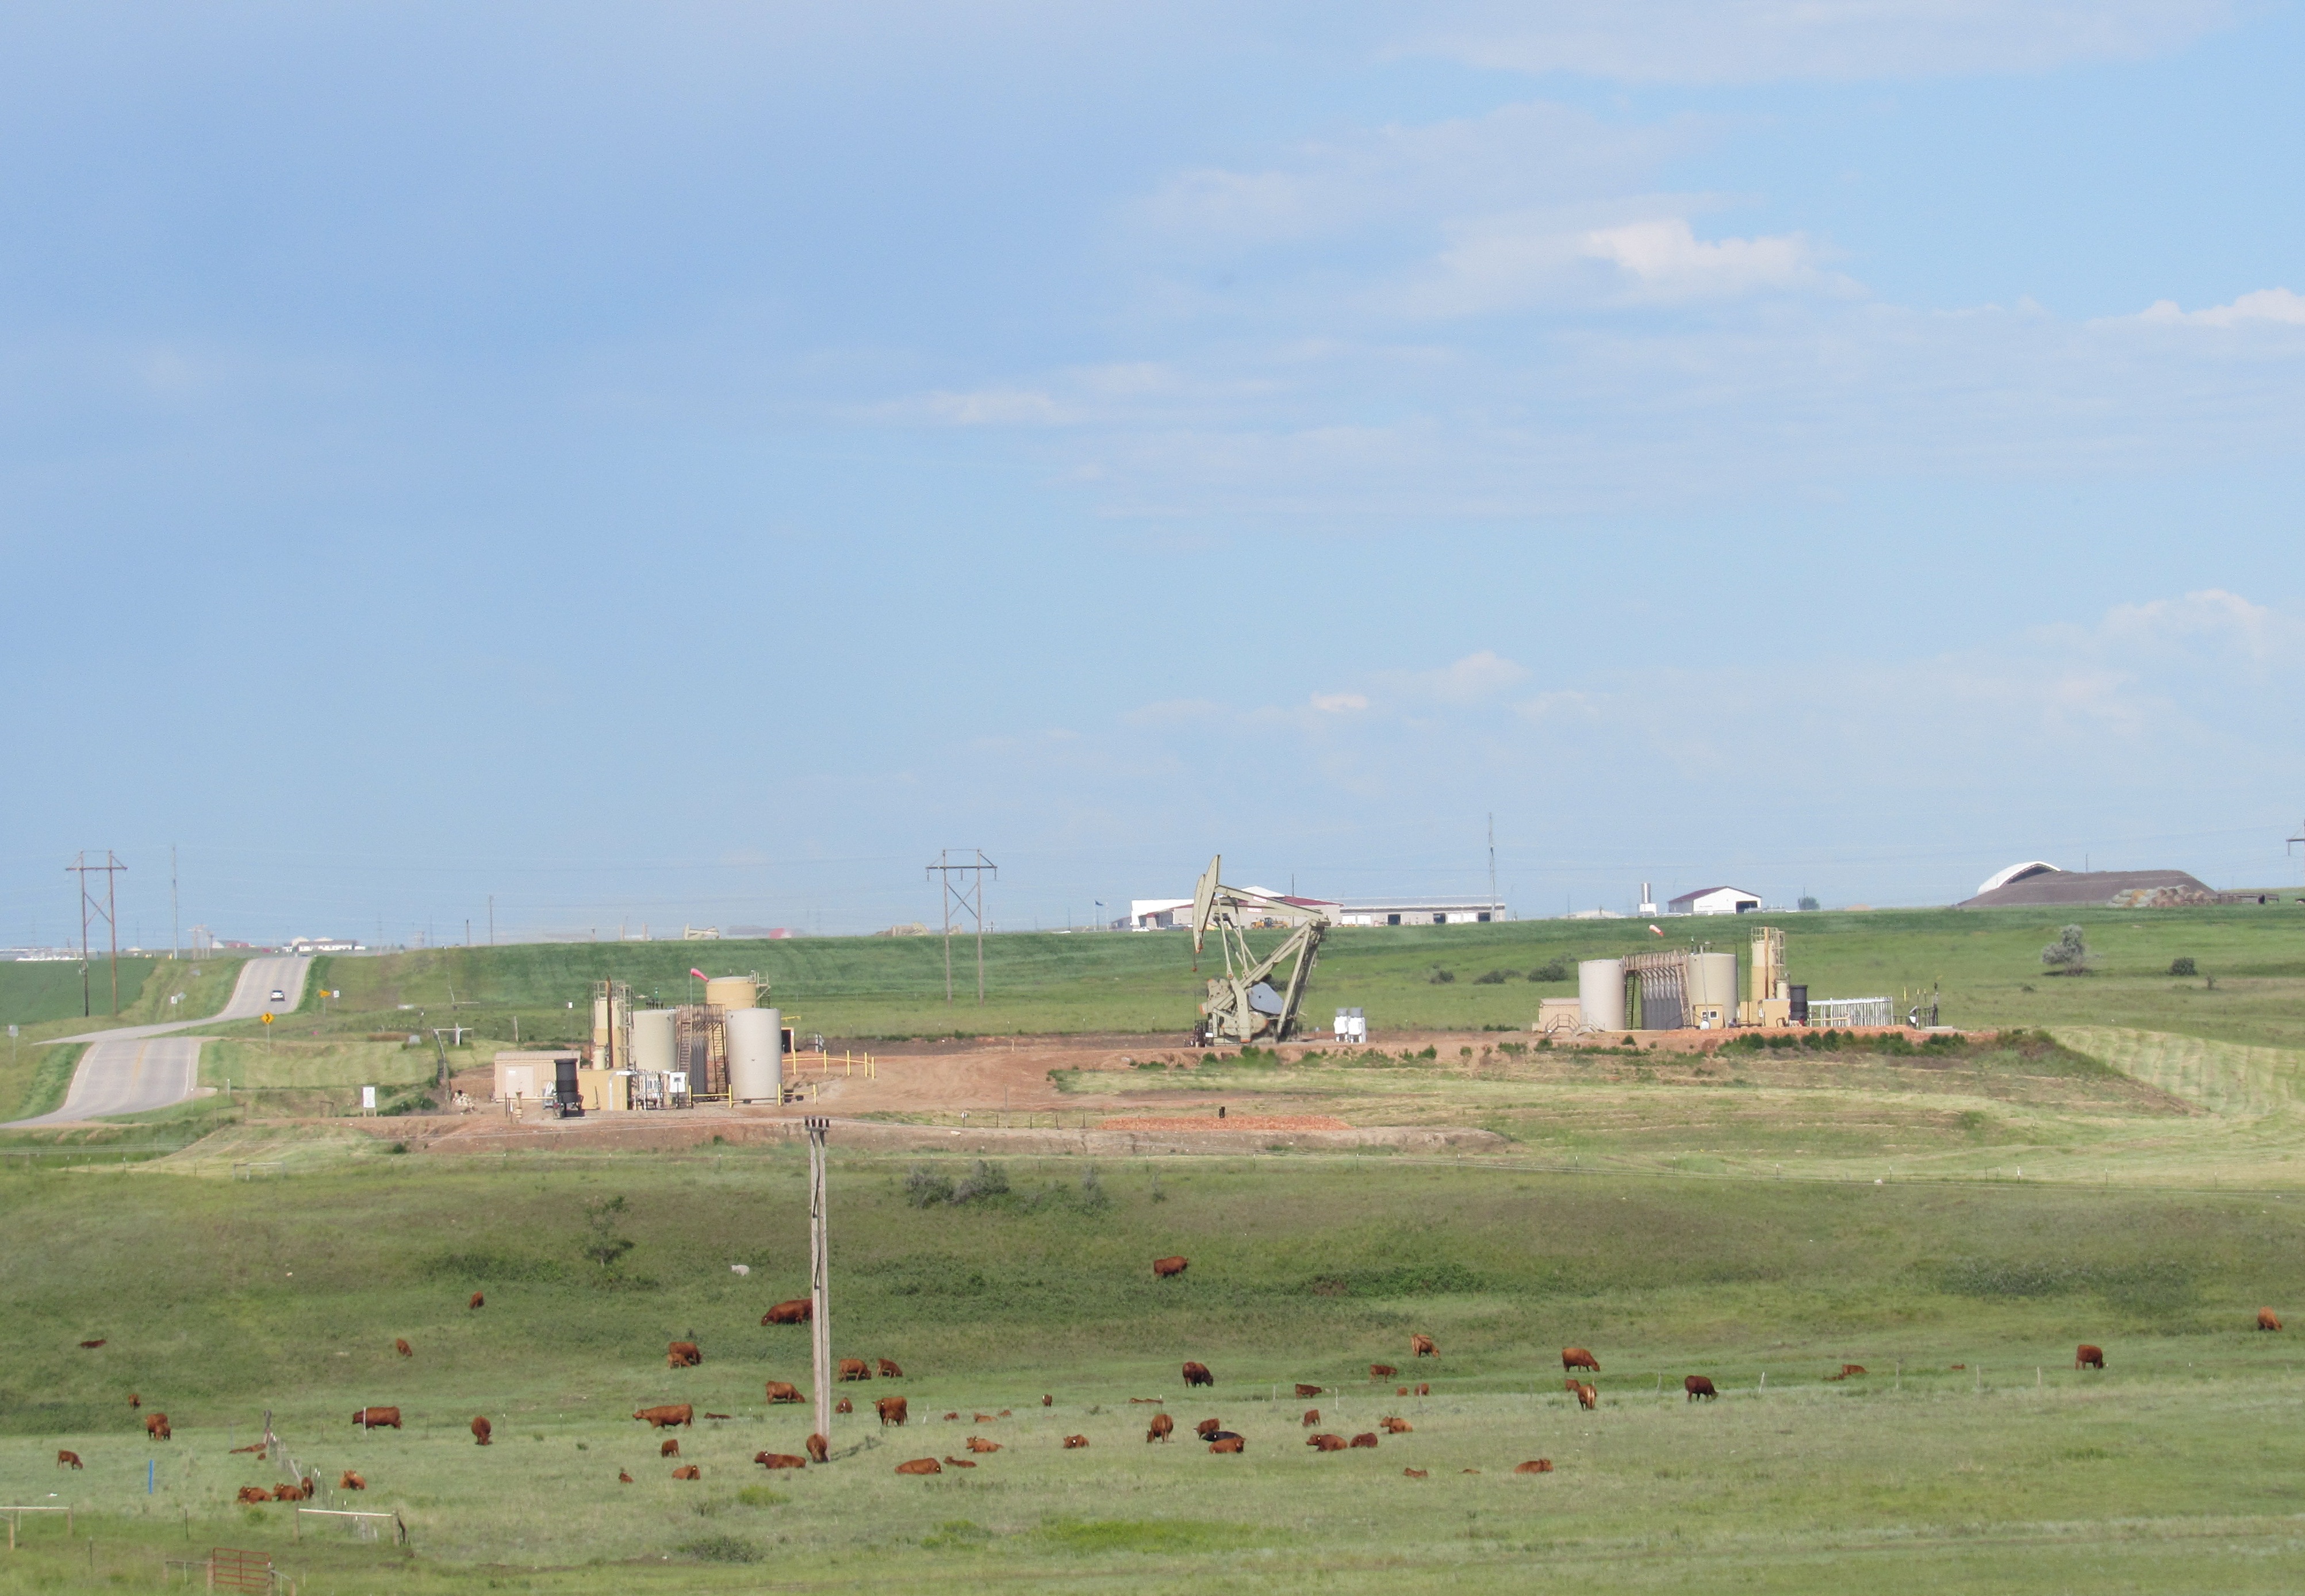
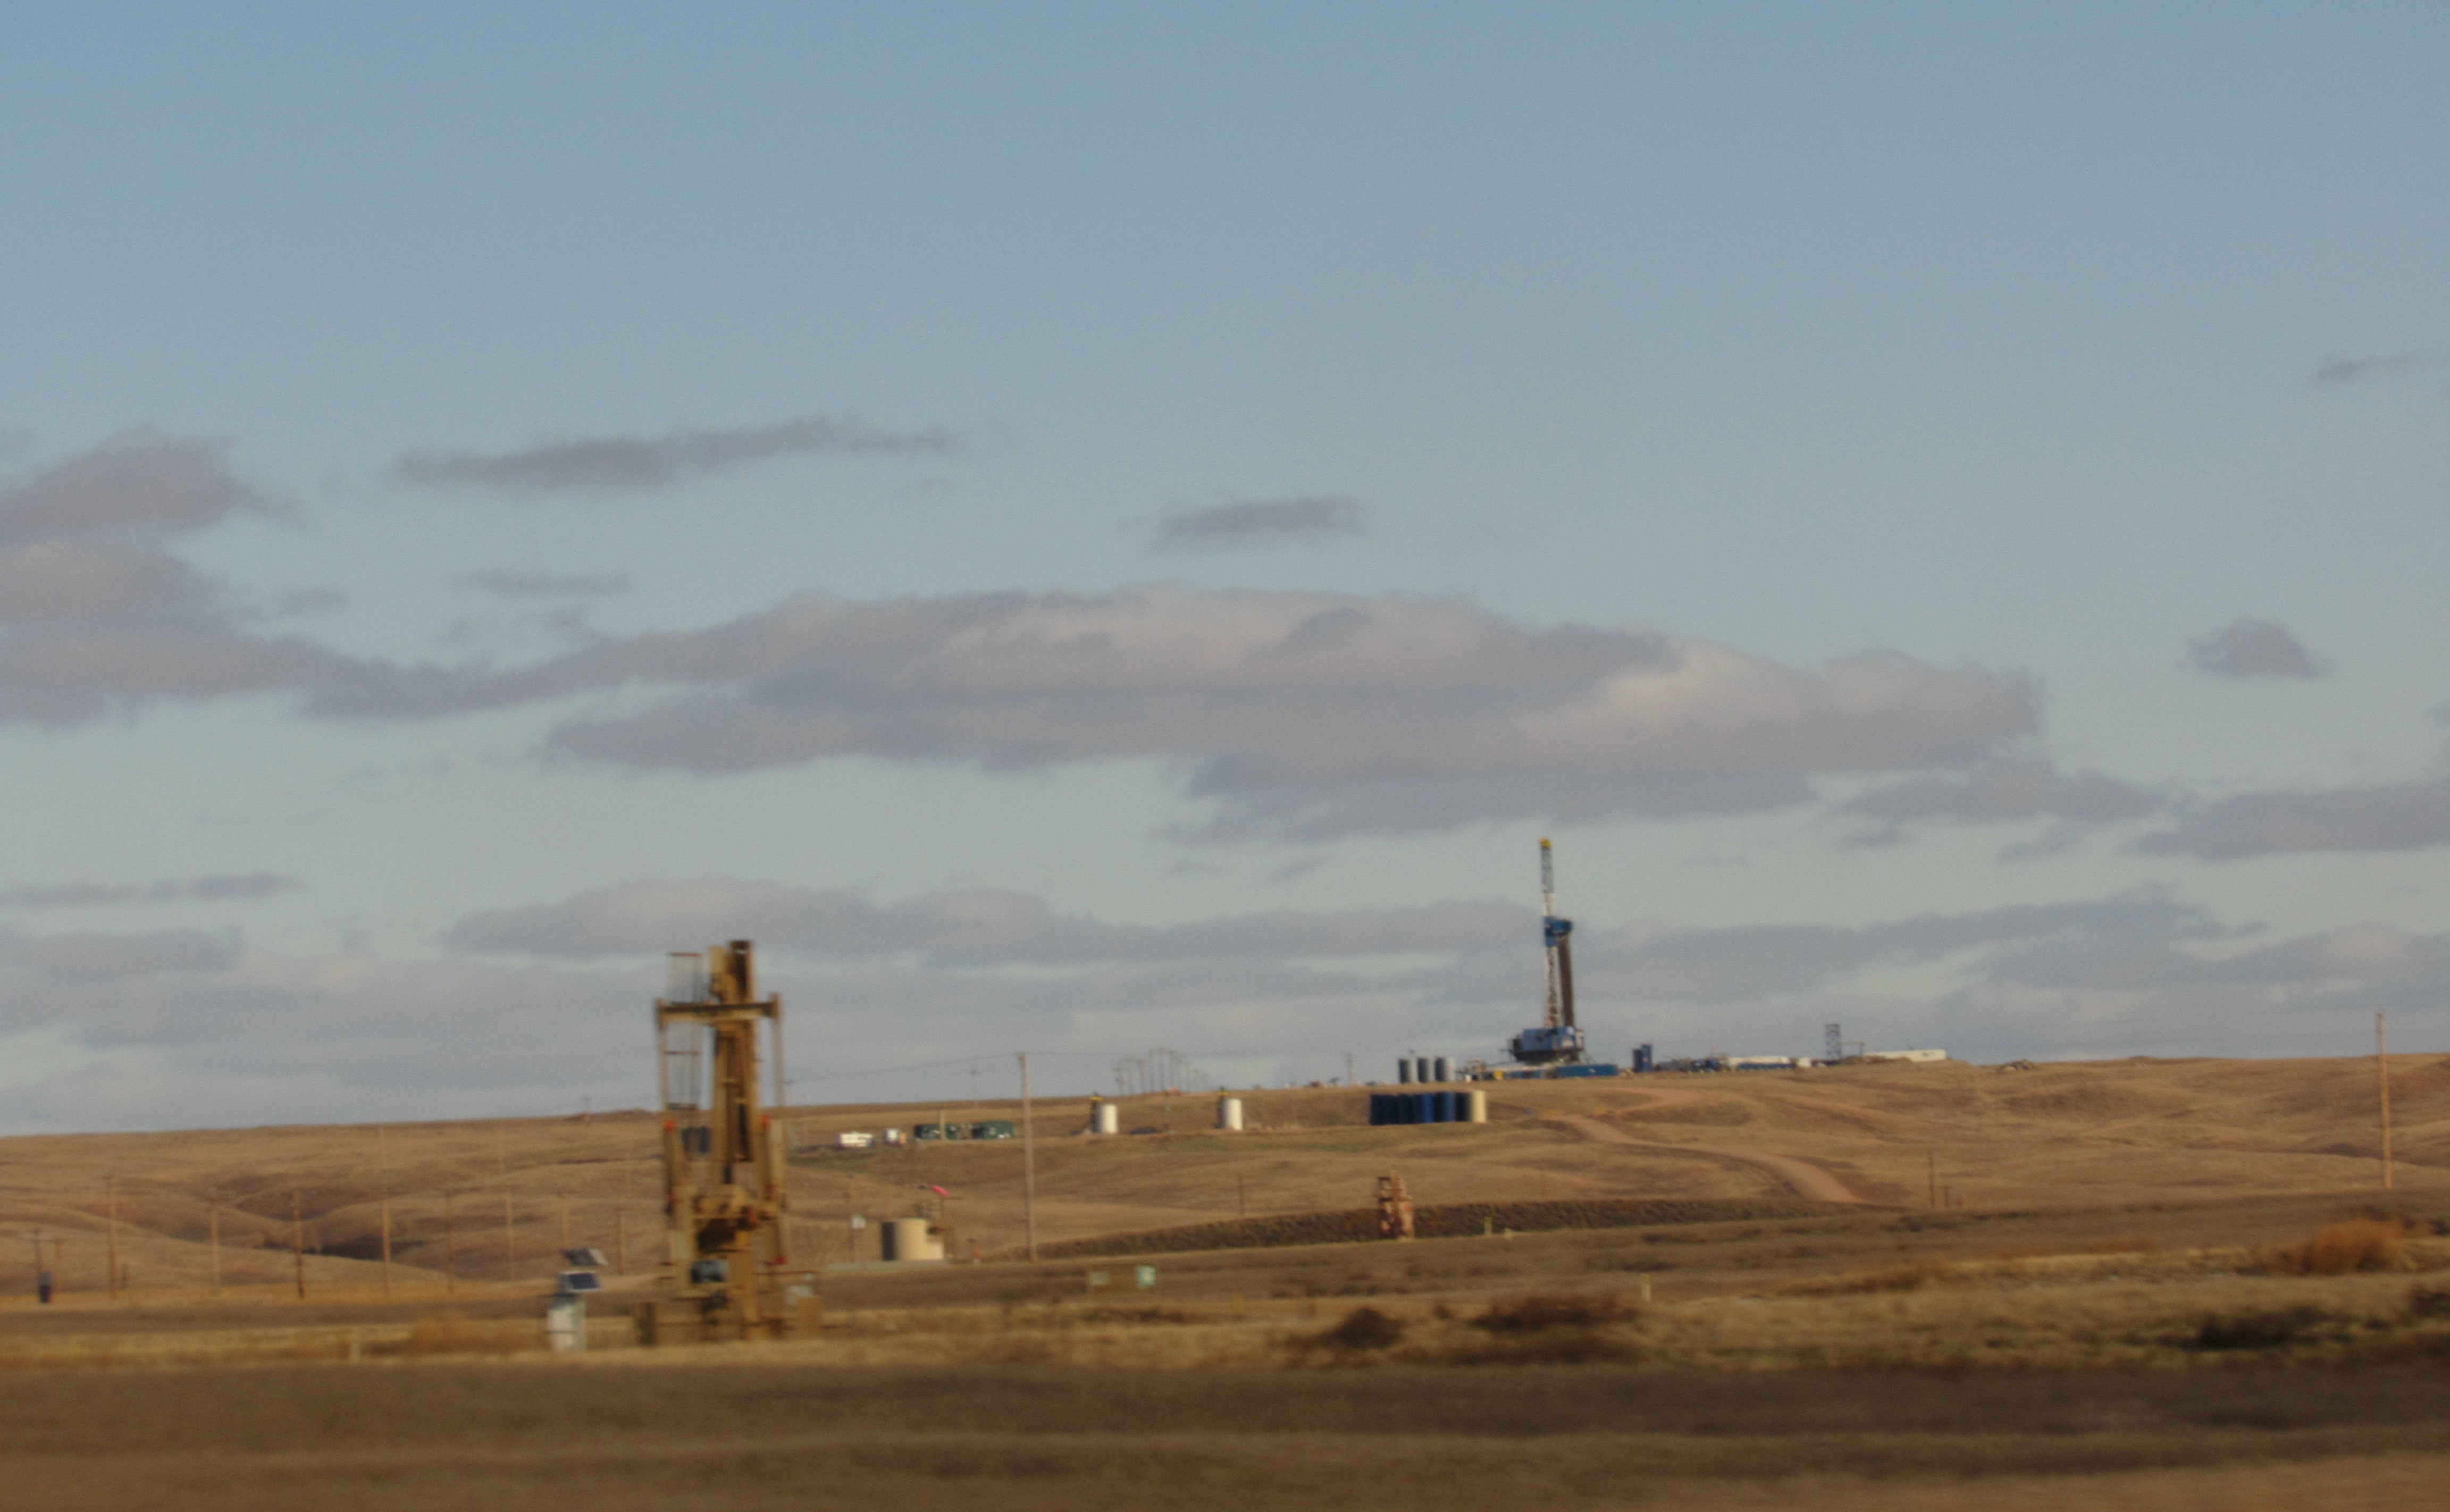
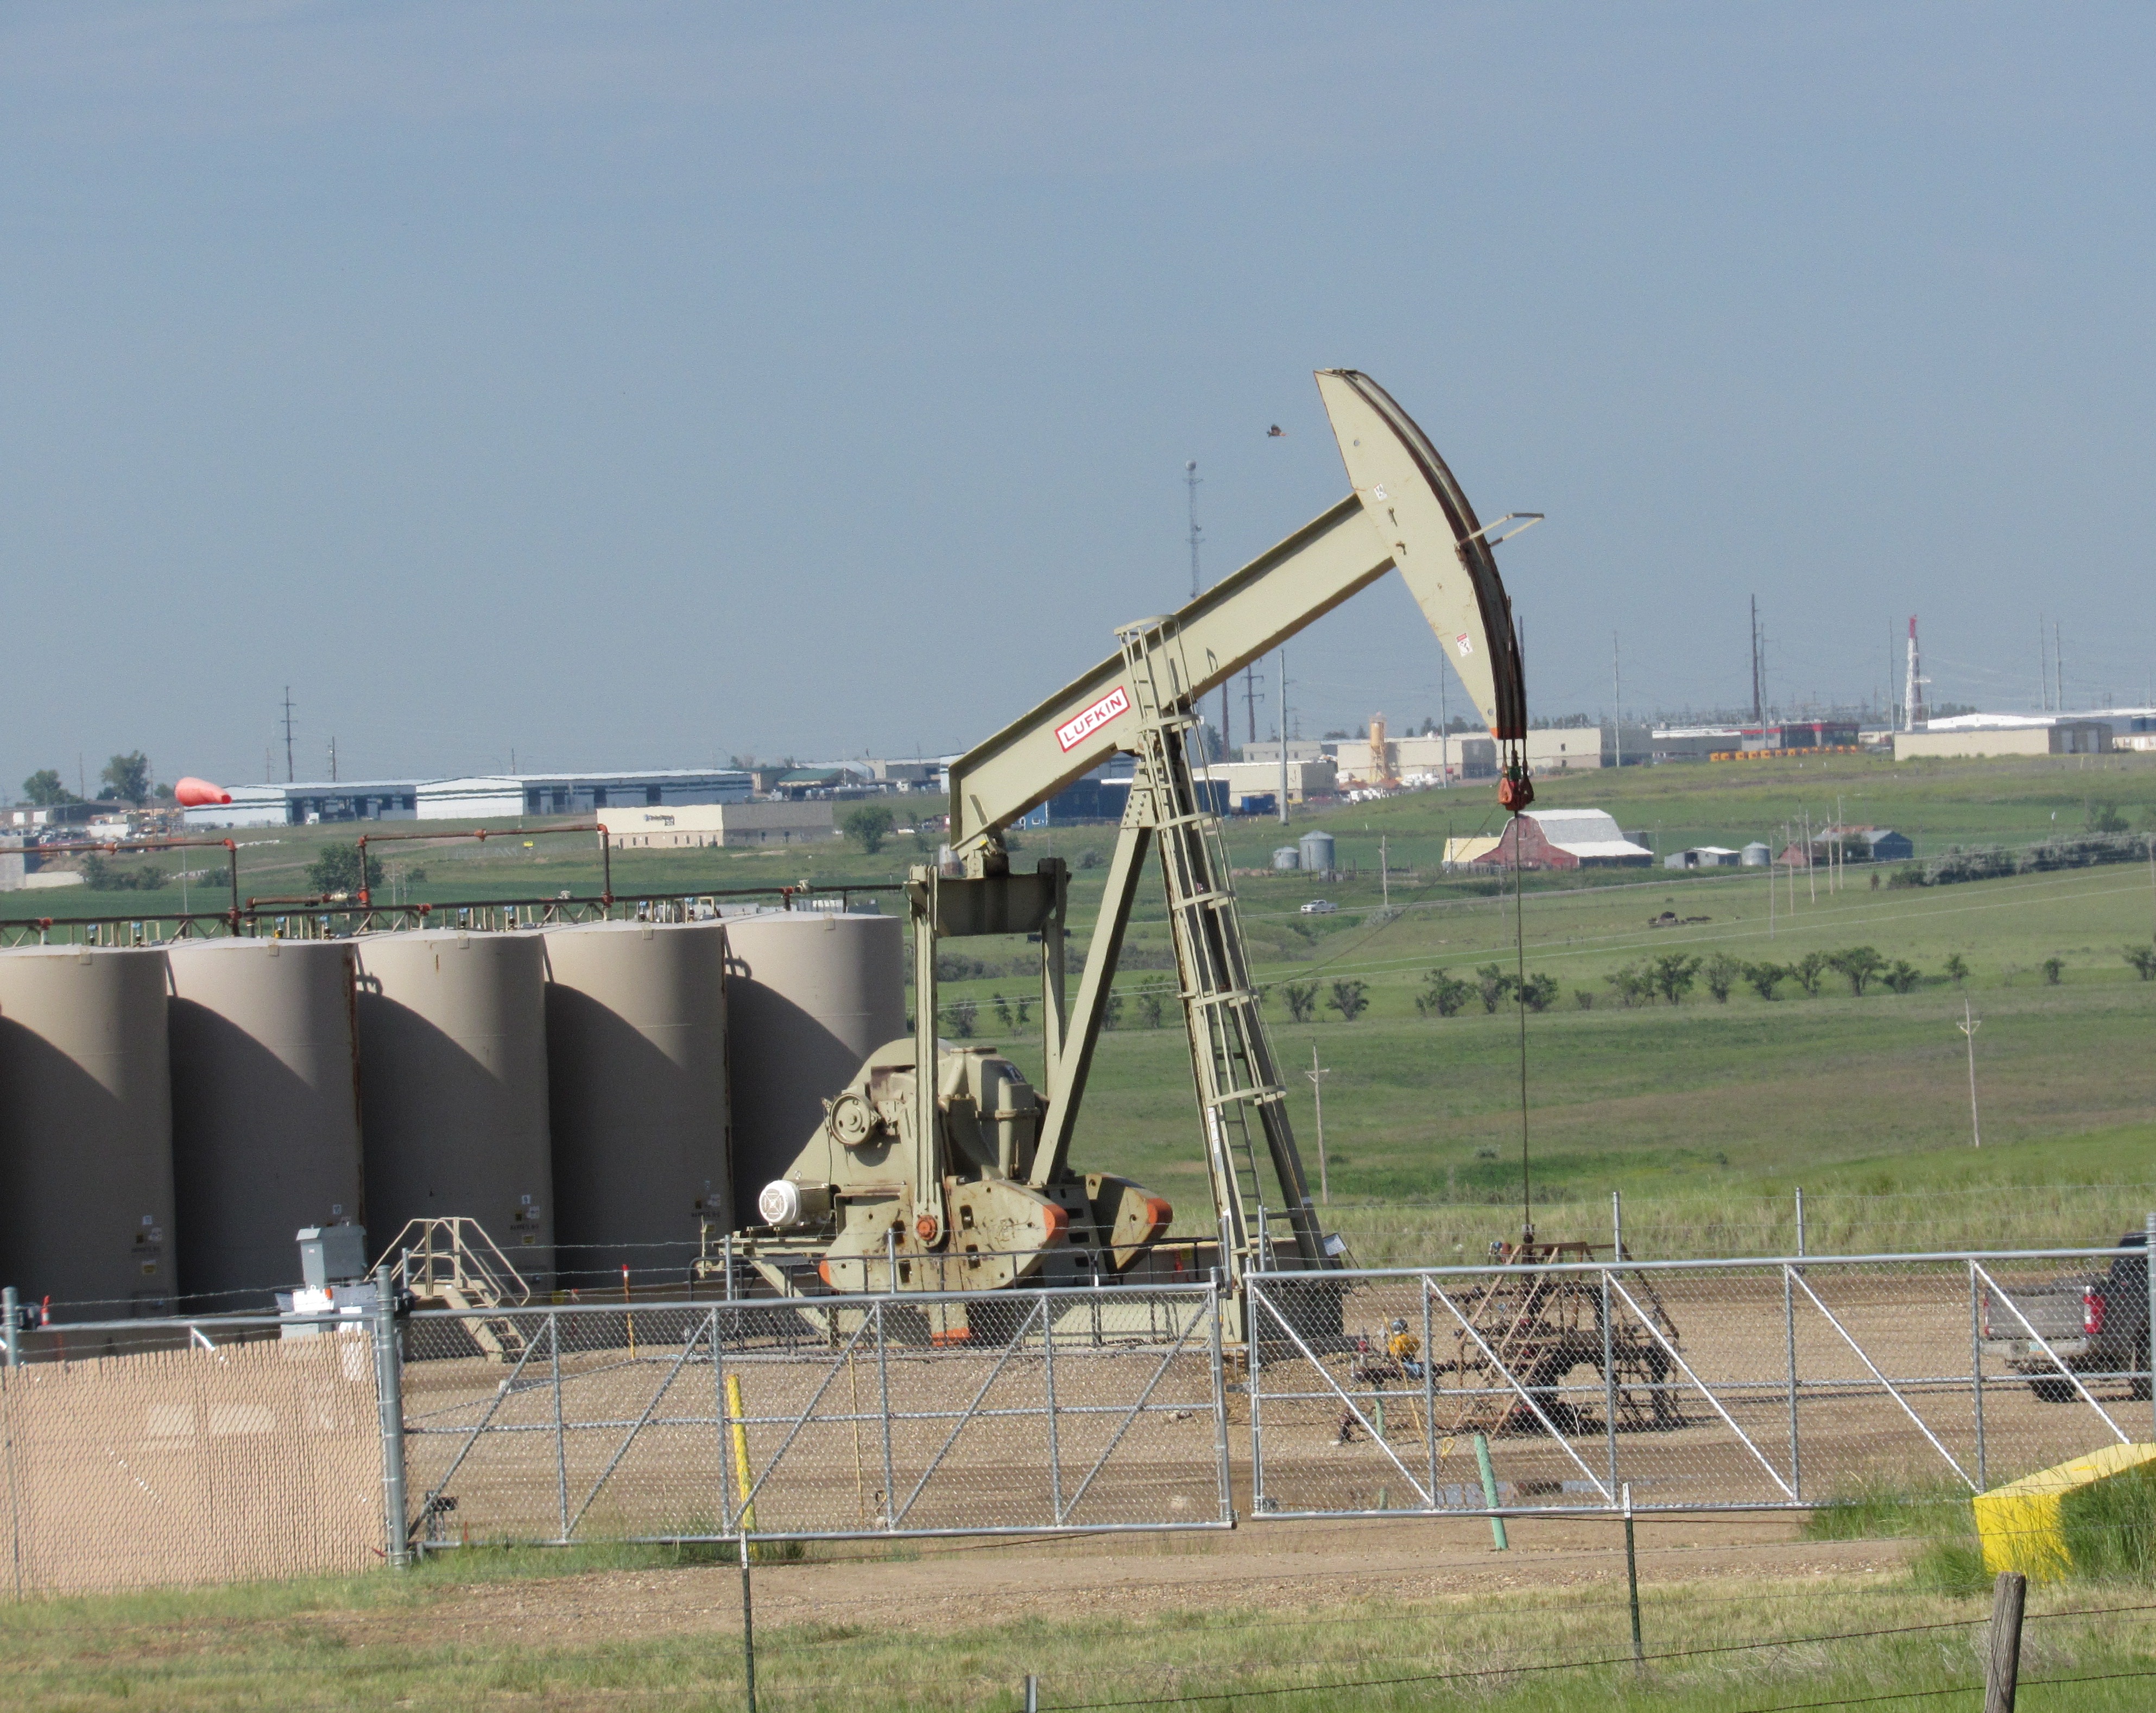
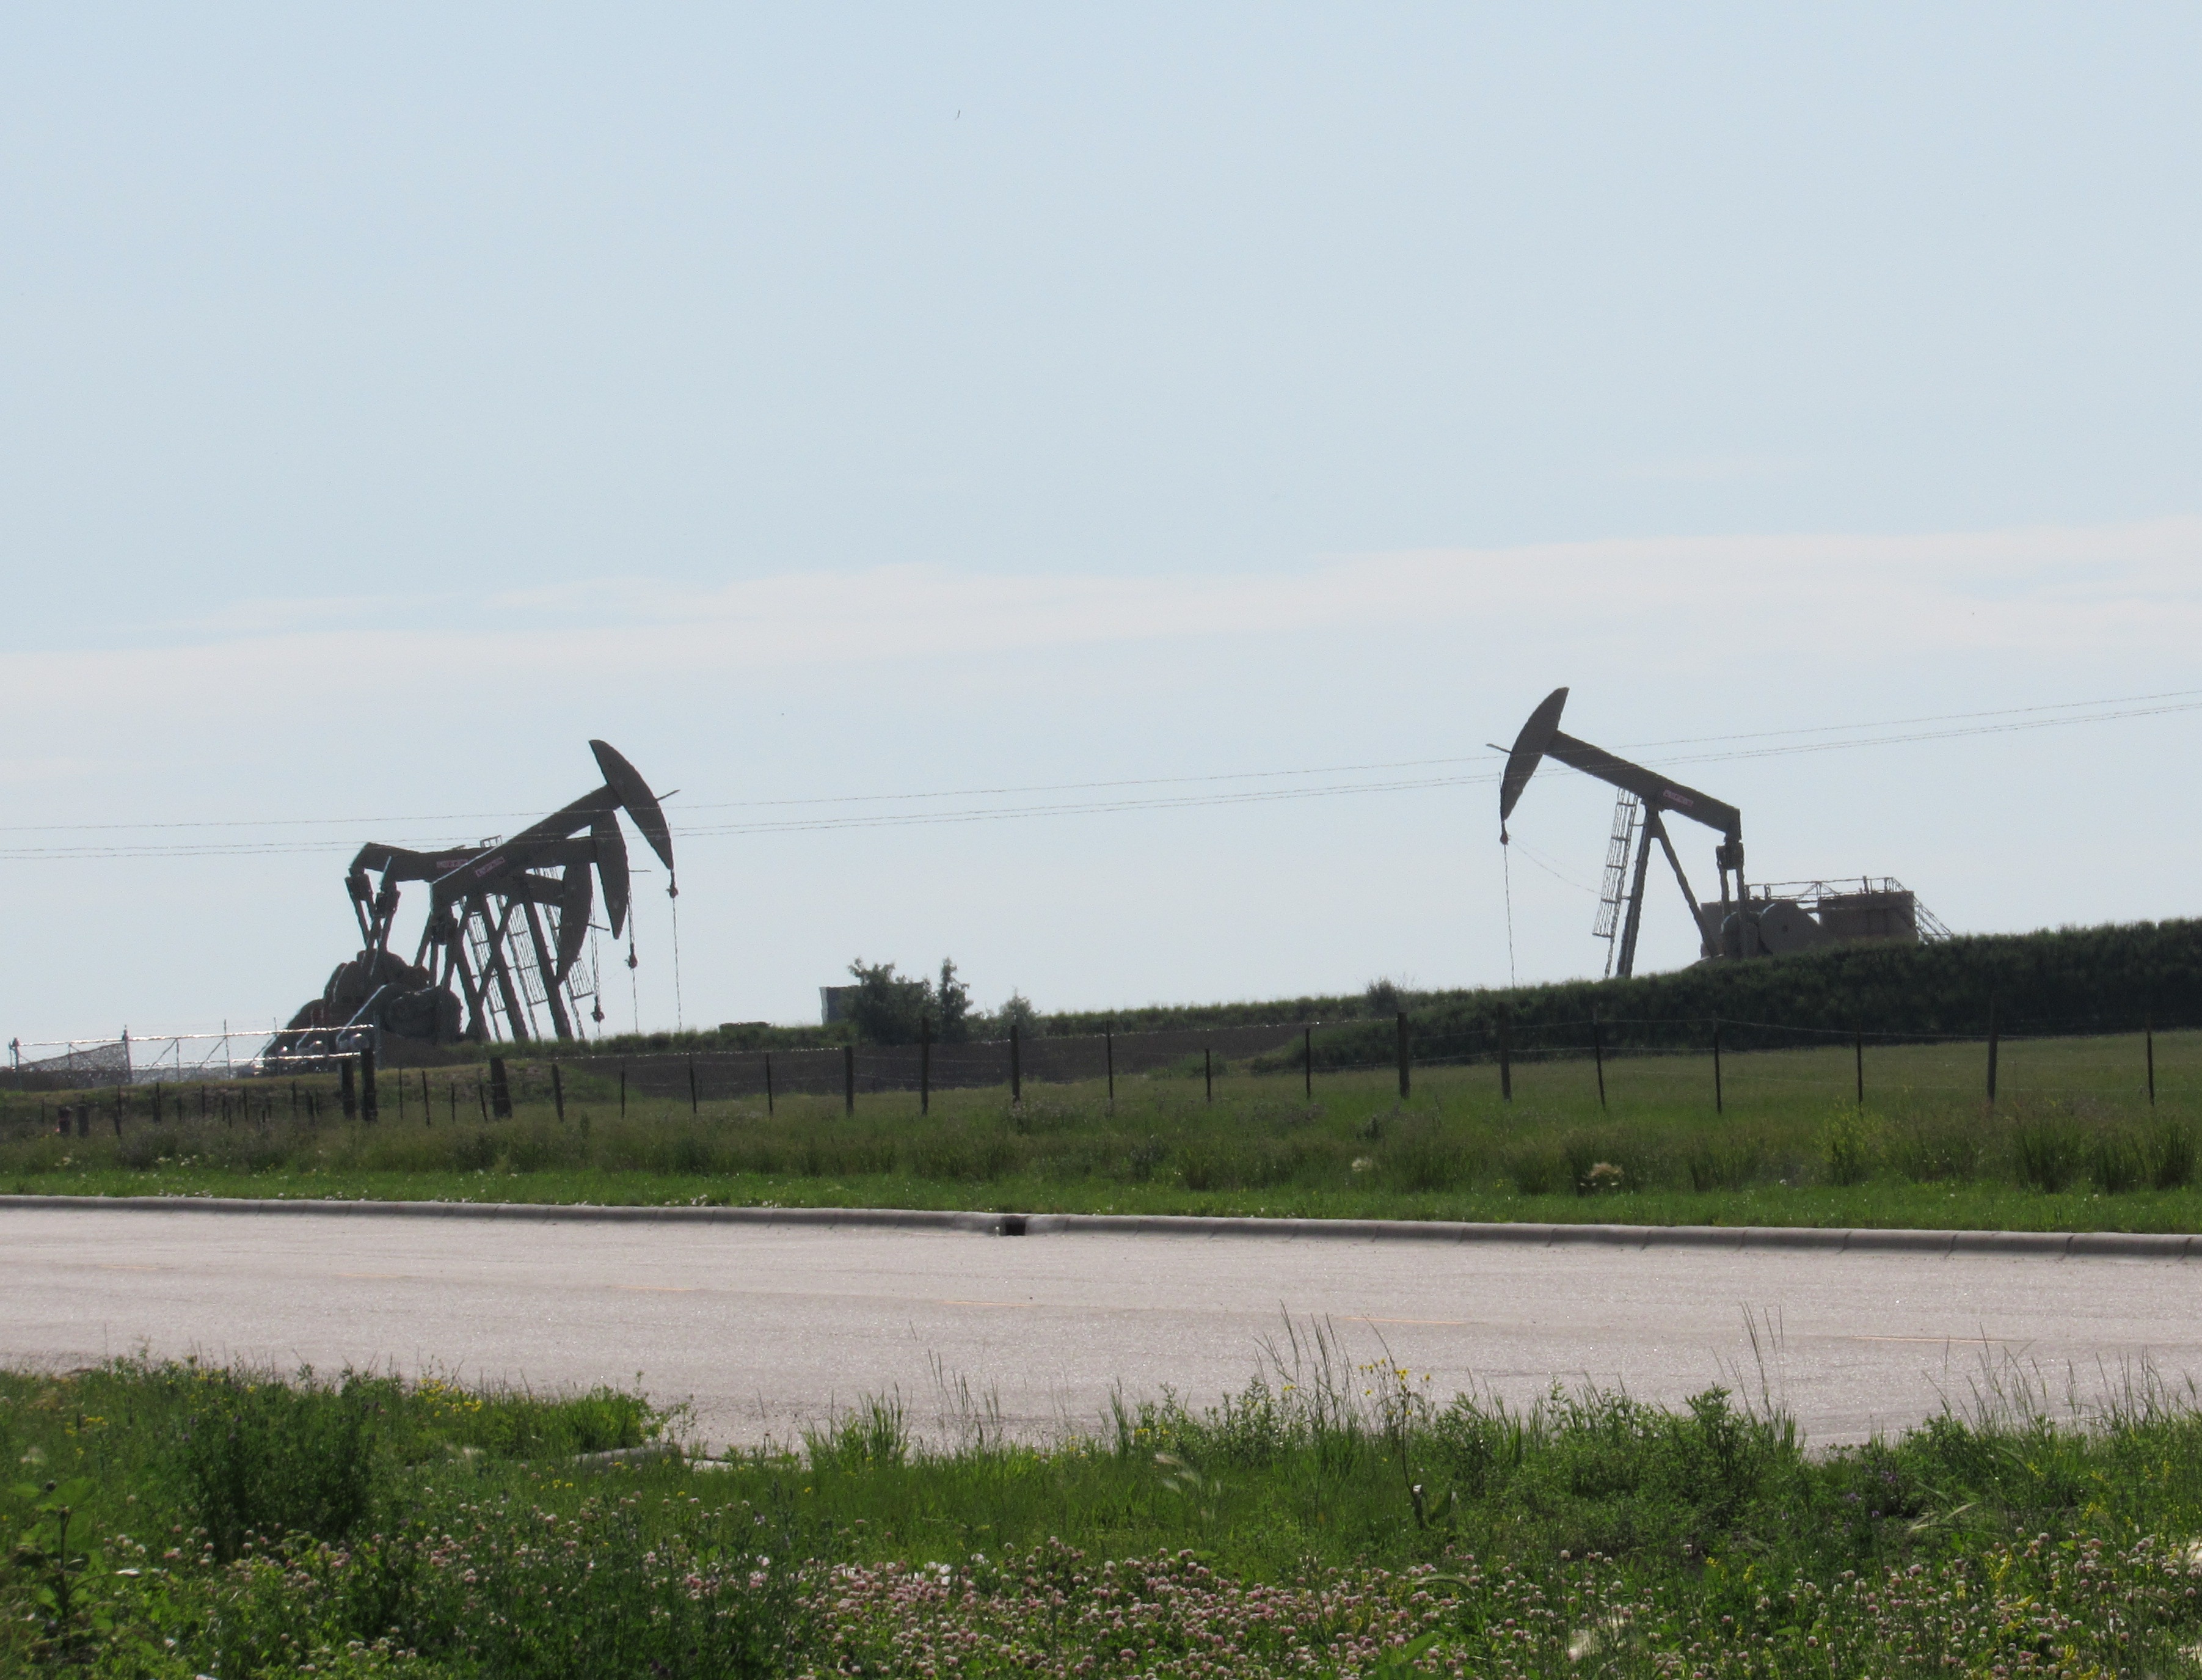
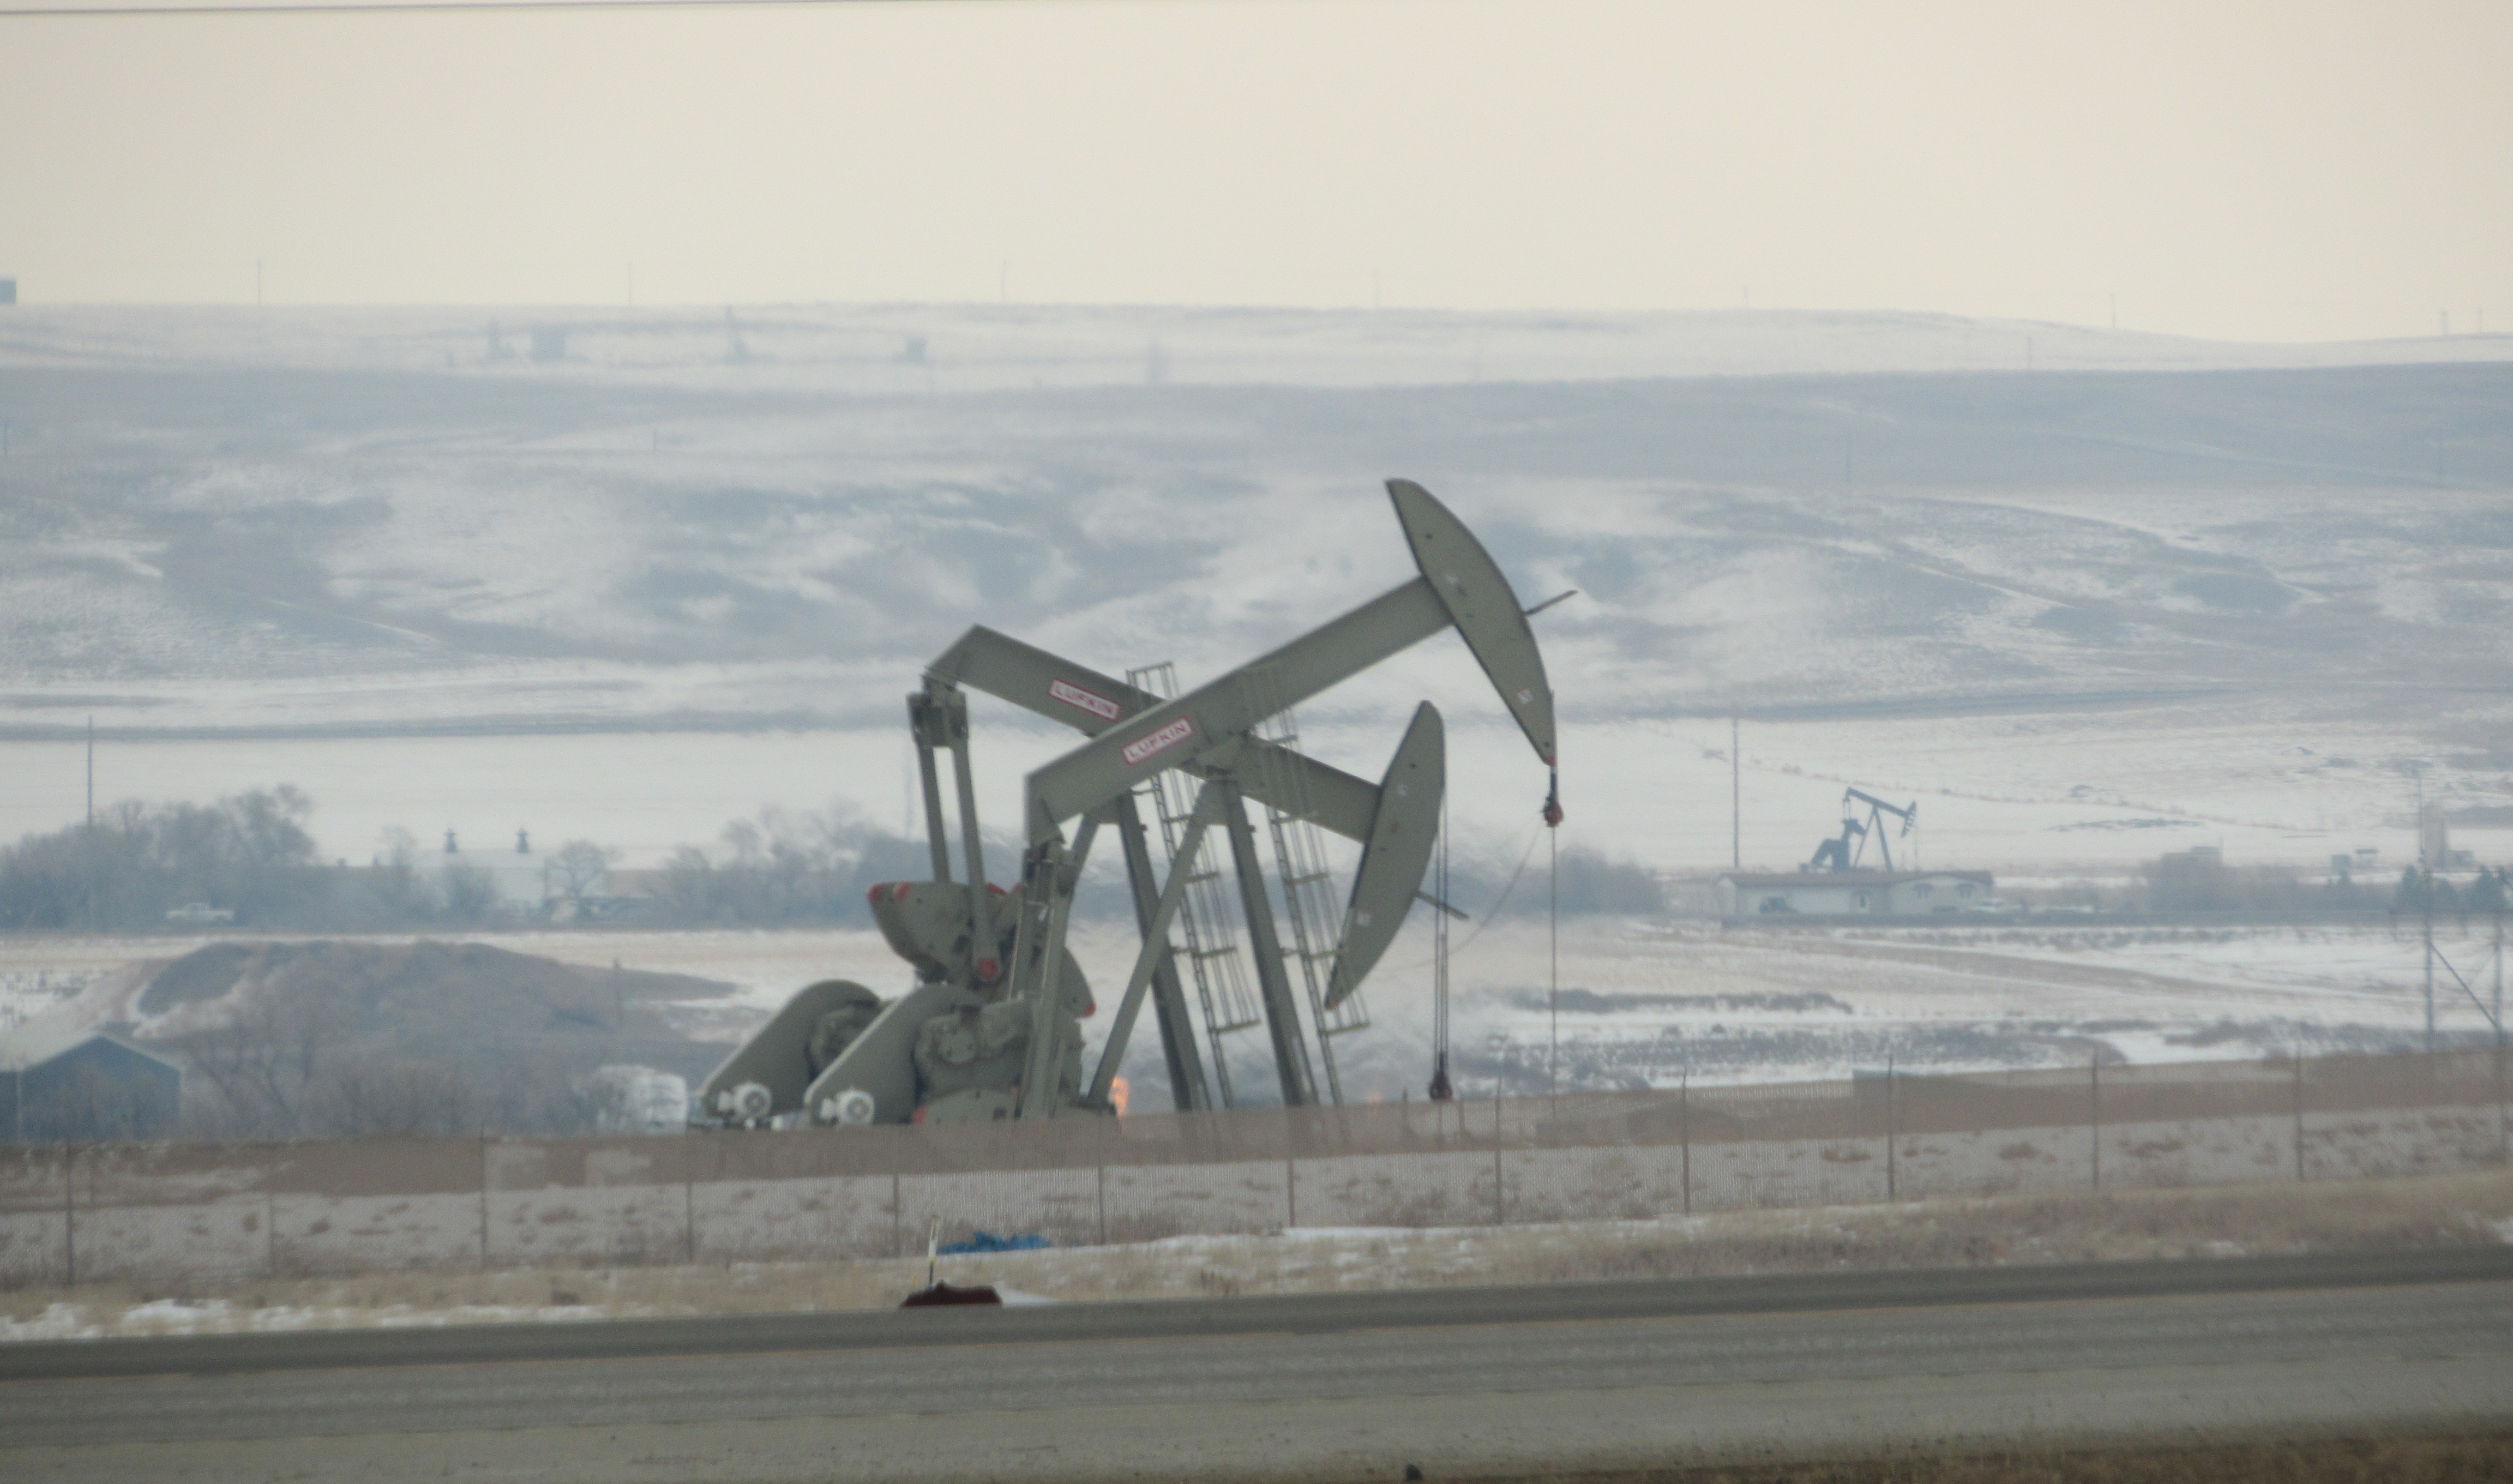
Producing well with pumpjack in the foreground. Drilling rig in background. Two more pads between them. Photo by James Ulvog.
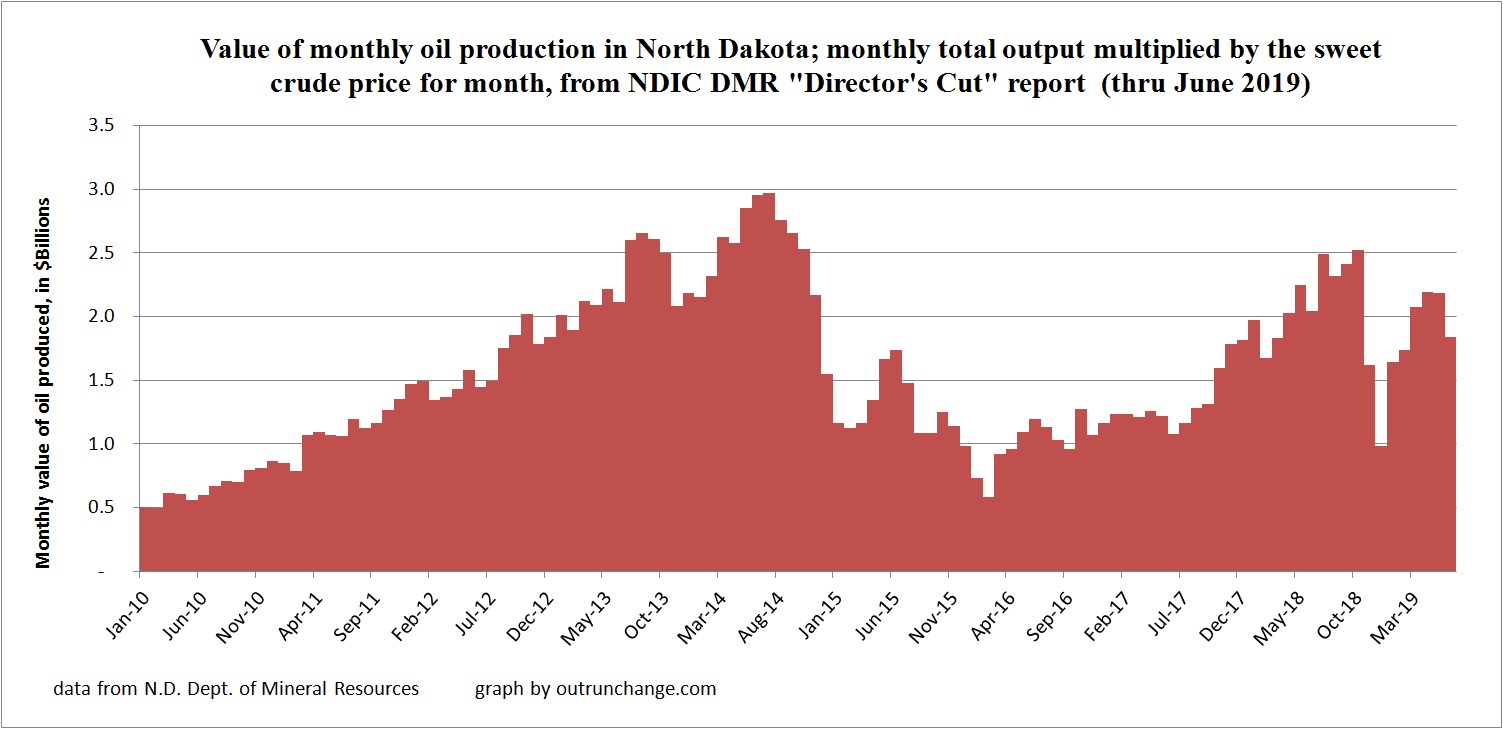
Release of the December production data in North Dakota lets us look at production for the full year. Following graphs show the average daily production and total for the year. Multiplying the monthly data by the sweet crude price in North Dakota reported in the Director’s Cut lets us see the value of production by month and total value for the year.
Workover rig working on well in North Dakota. Photo by James Ulvog.
North Dakota oil production in December 2019 is fourth highest level on record, after setting new production level in 5 of last 6 months.
Average daily production in the state was 1,475,685 barrels of oil per day (bopd) (preliminary) after hitting the highest level ever of 1,519,037 bopd (revised) in November. The November production broke the state’s record for the fifth time in six months, and the twelfth time in the last twenty months.
The routine record-level production is being achieved with stable and low level of drilling rigs and without the wild-west craziness in the local economy that existed before 2014.
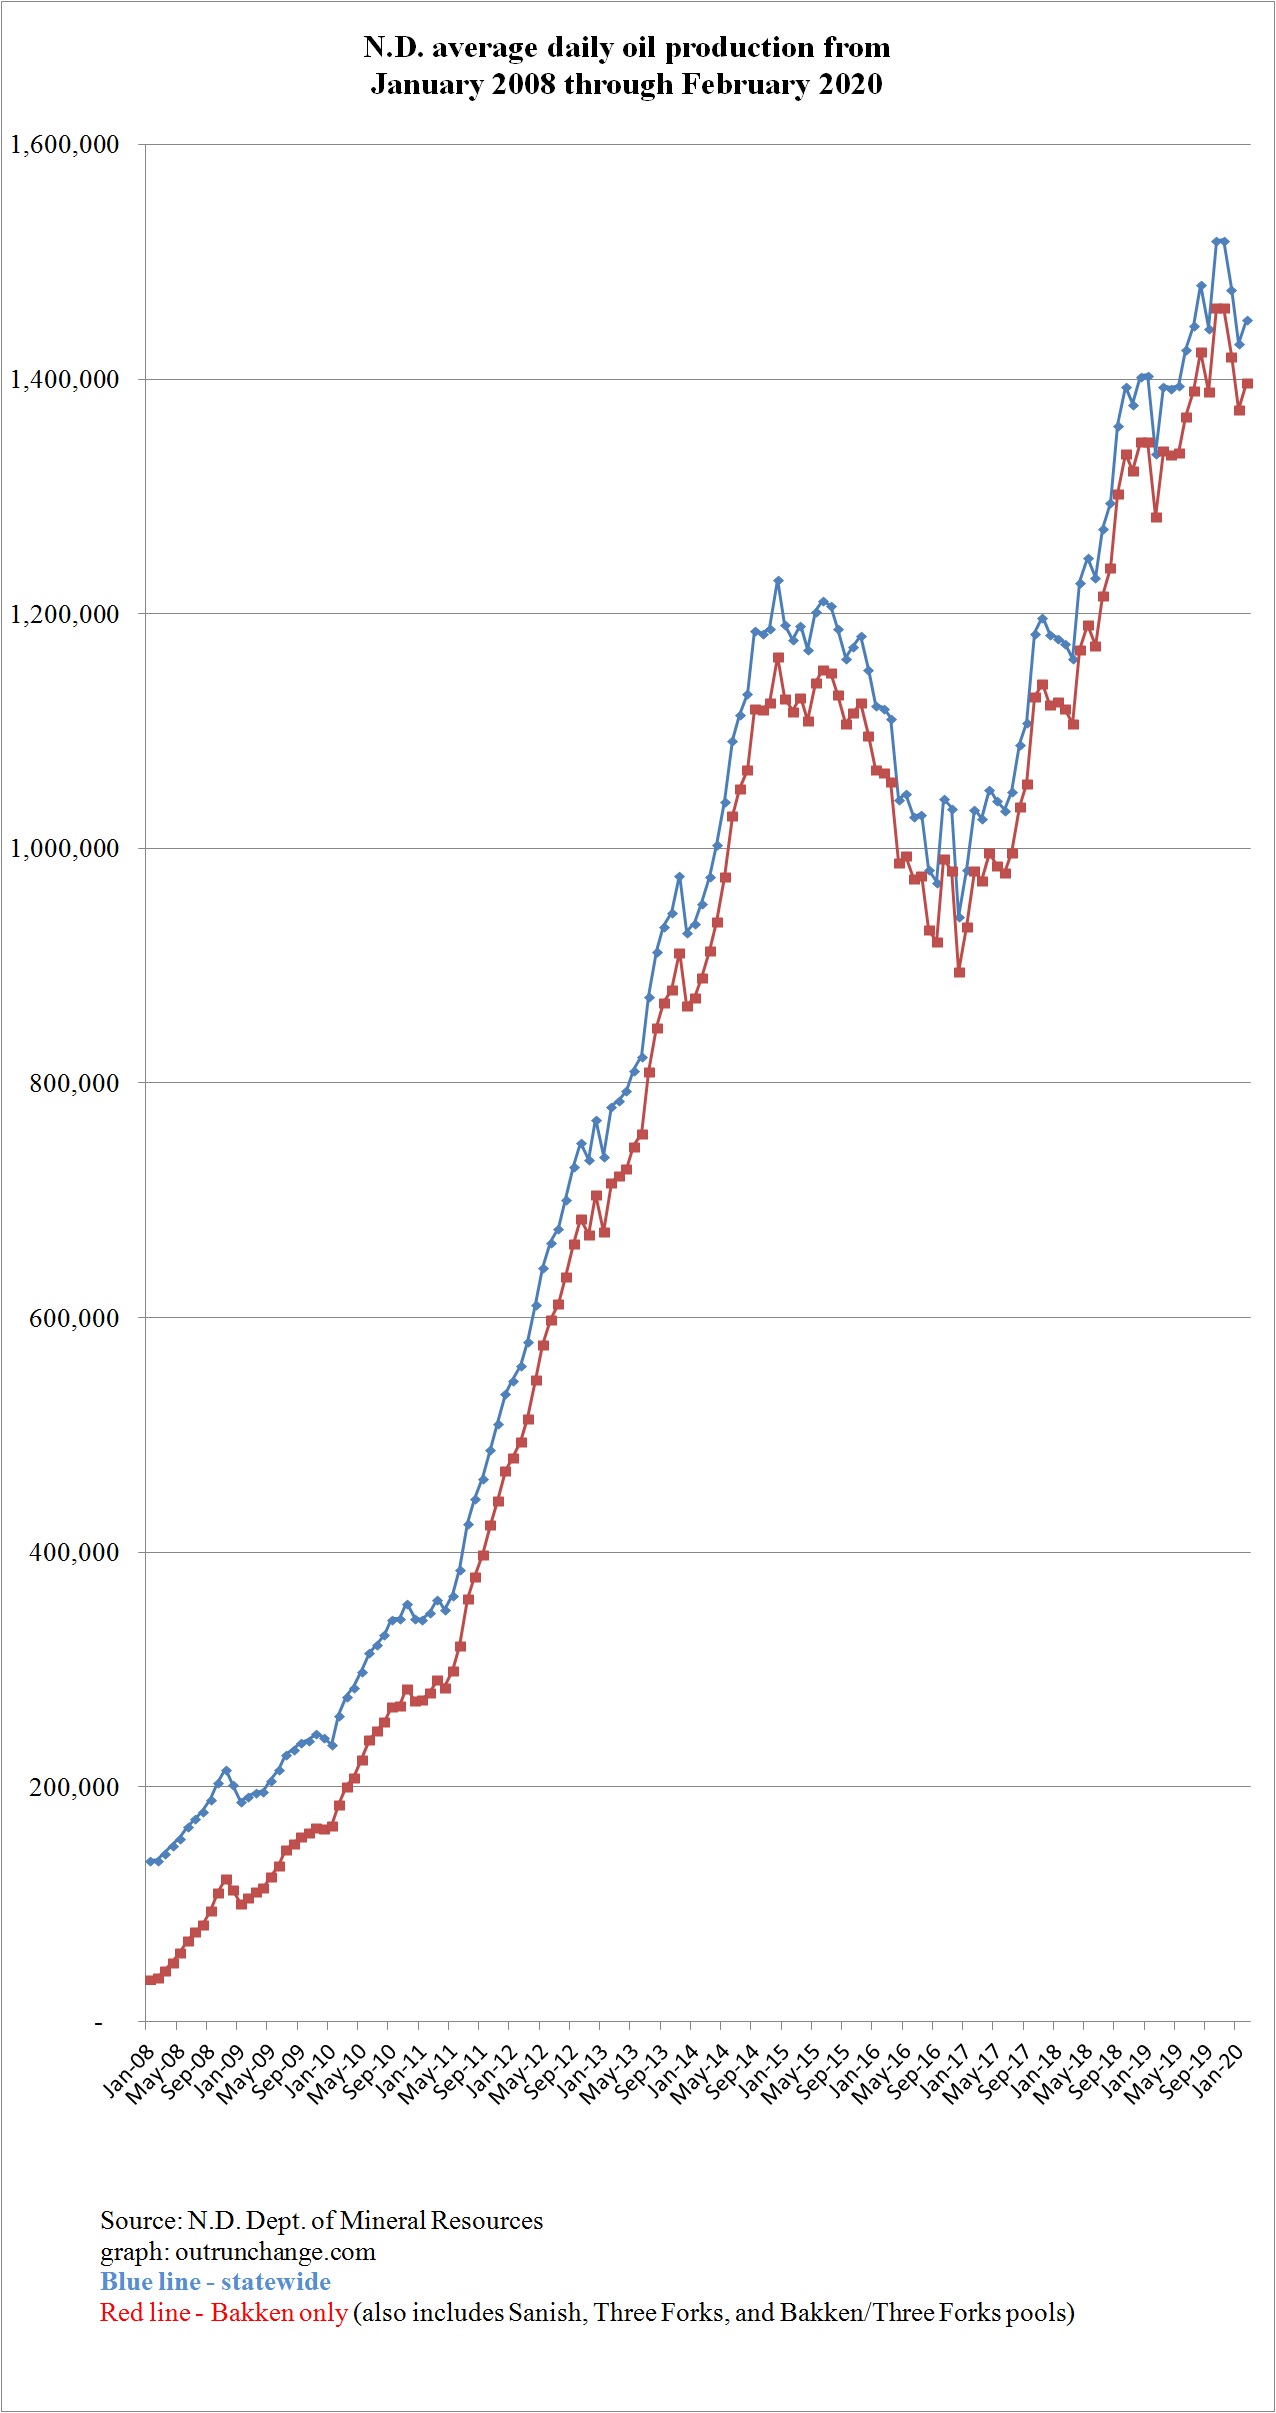
Graph of the average daily production in the state and in the Bakken pool:
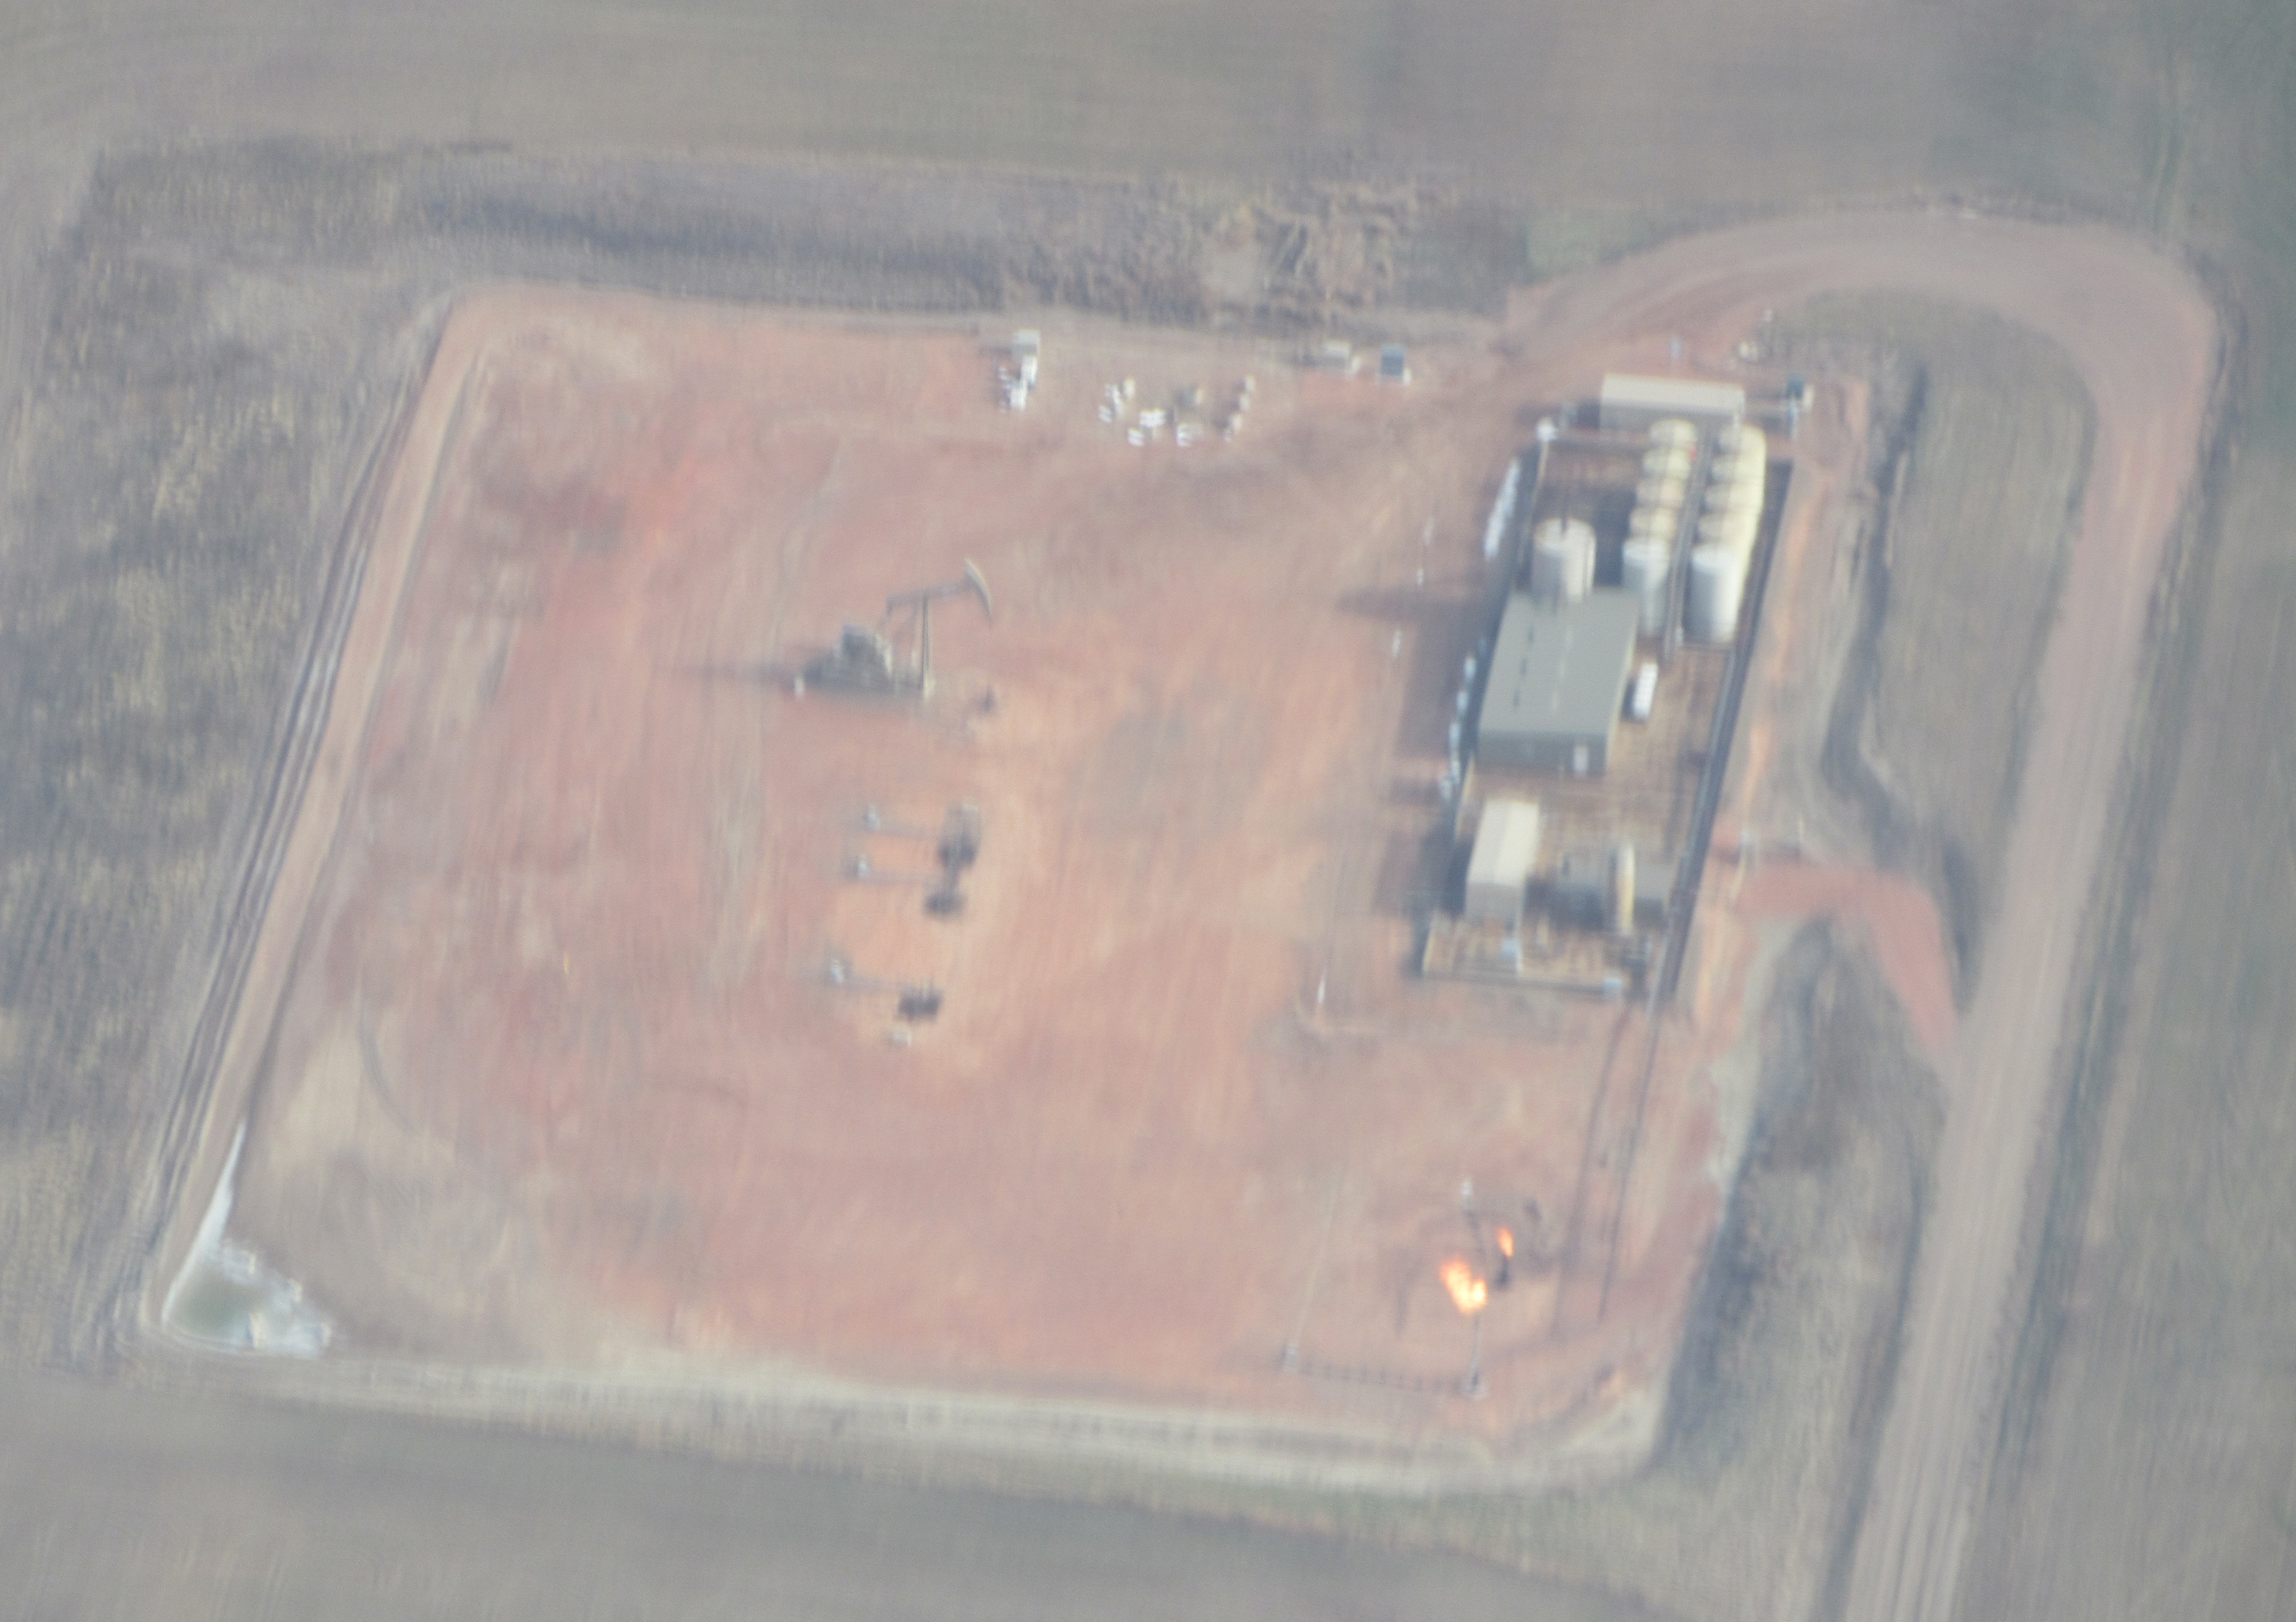
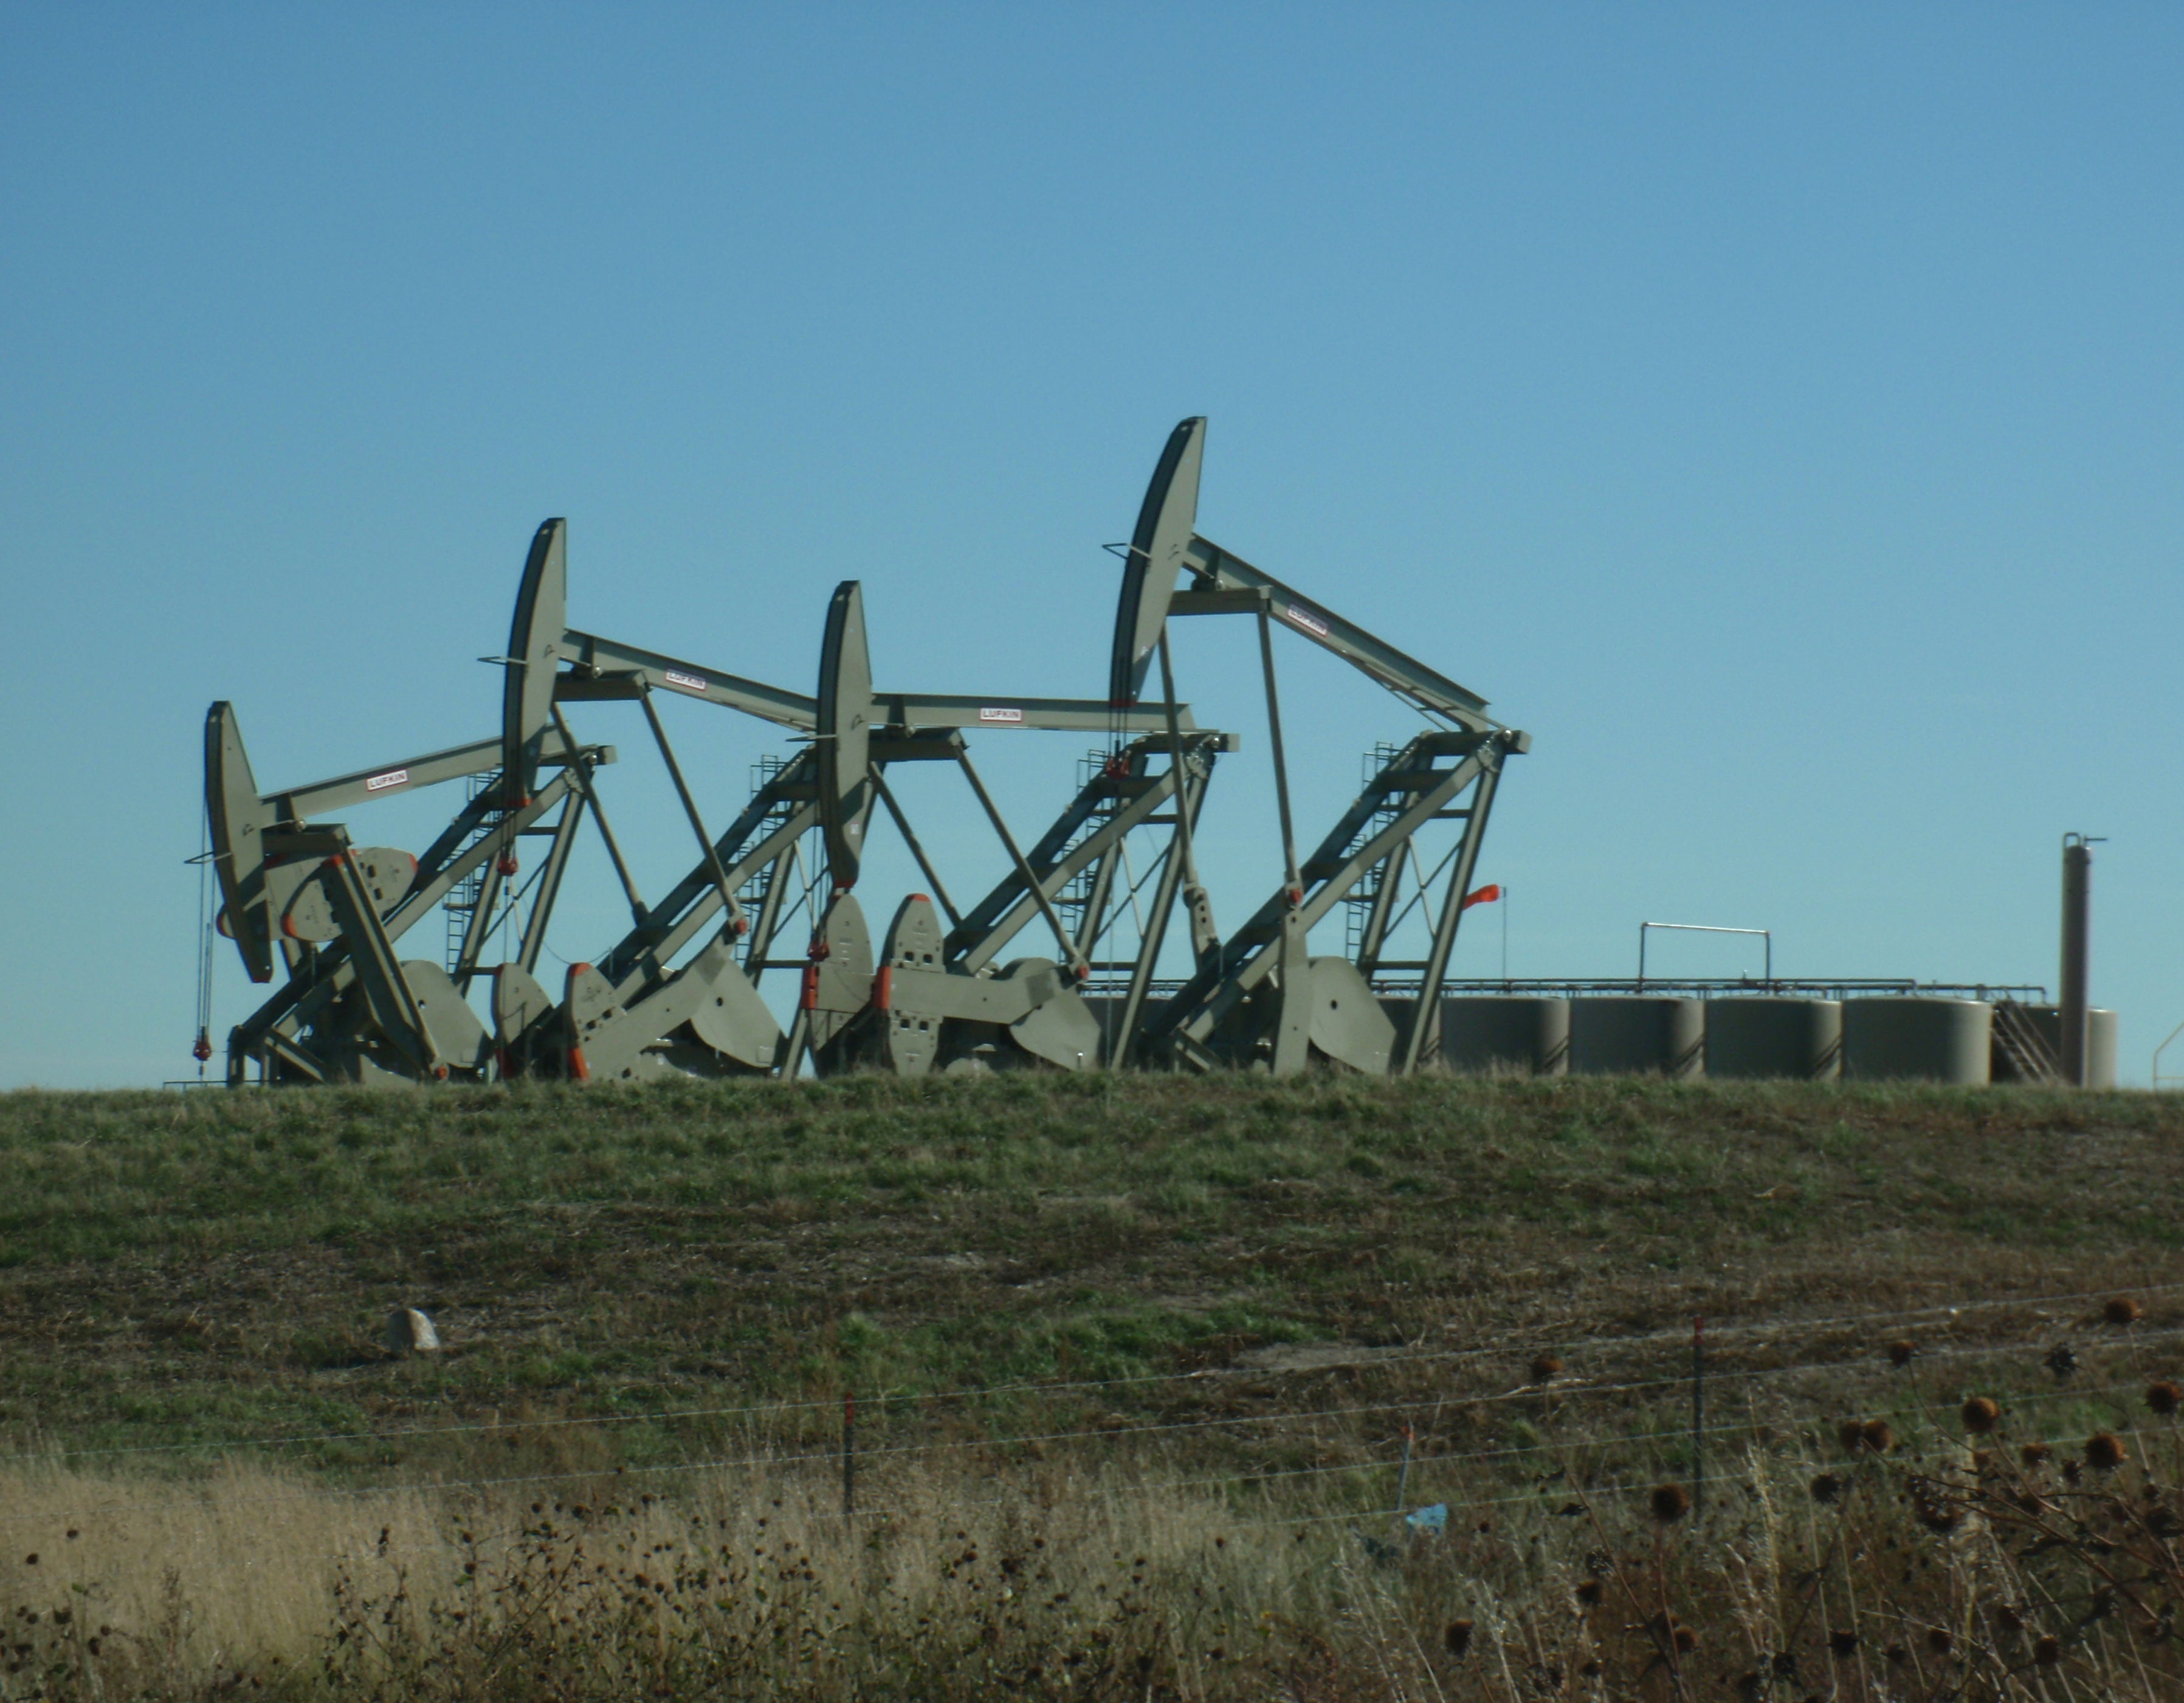
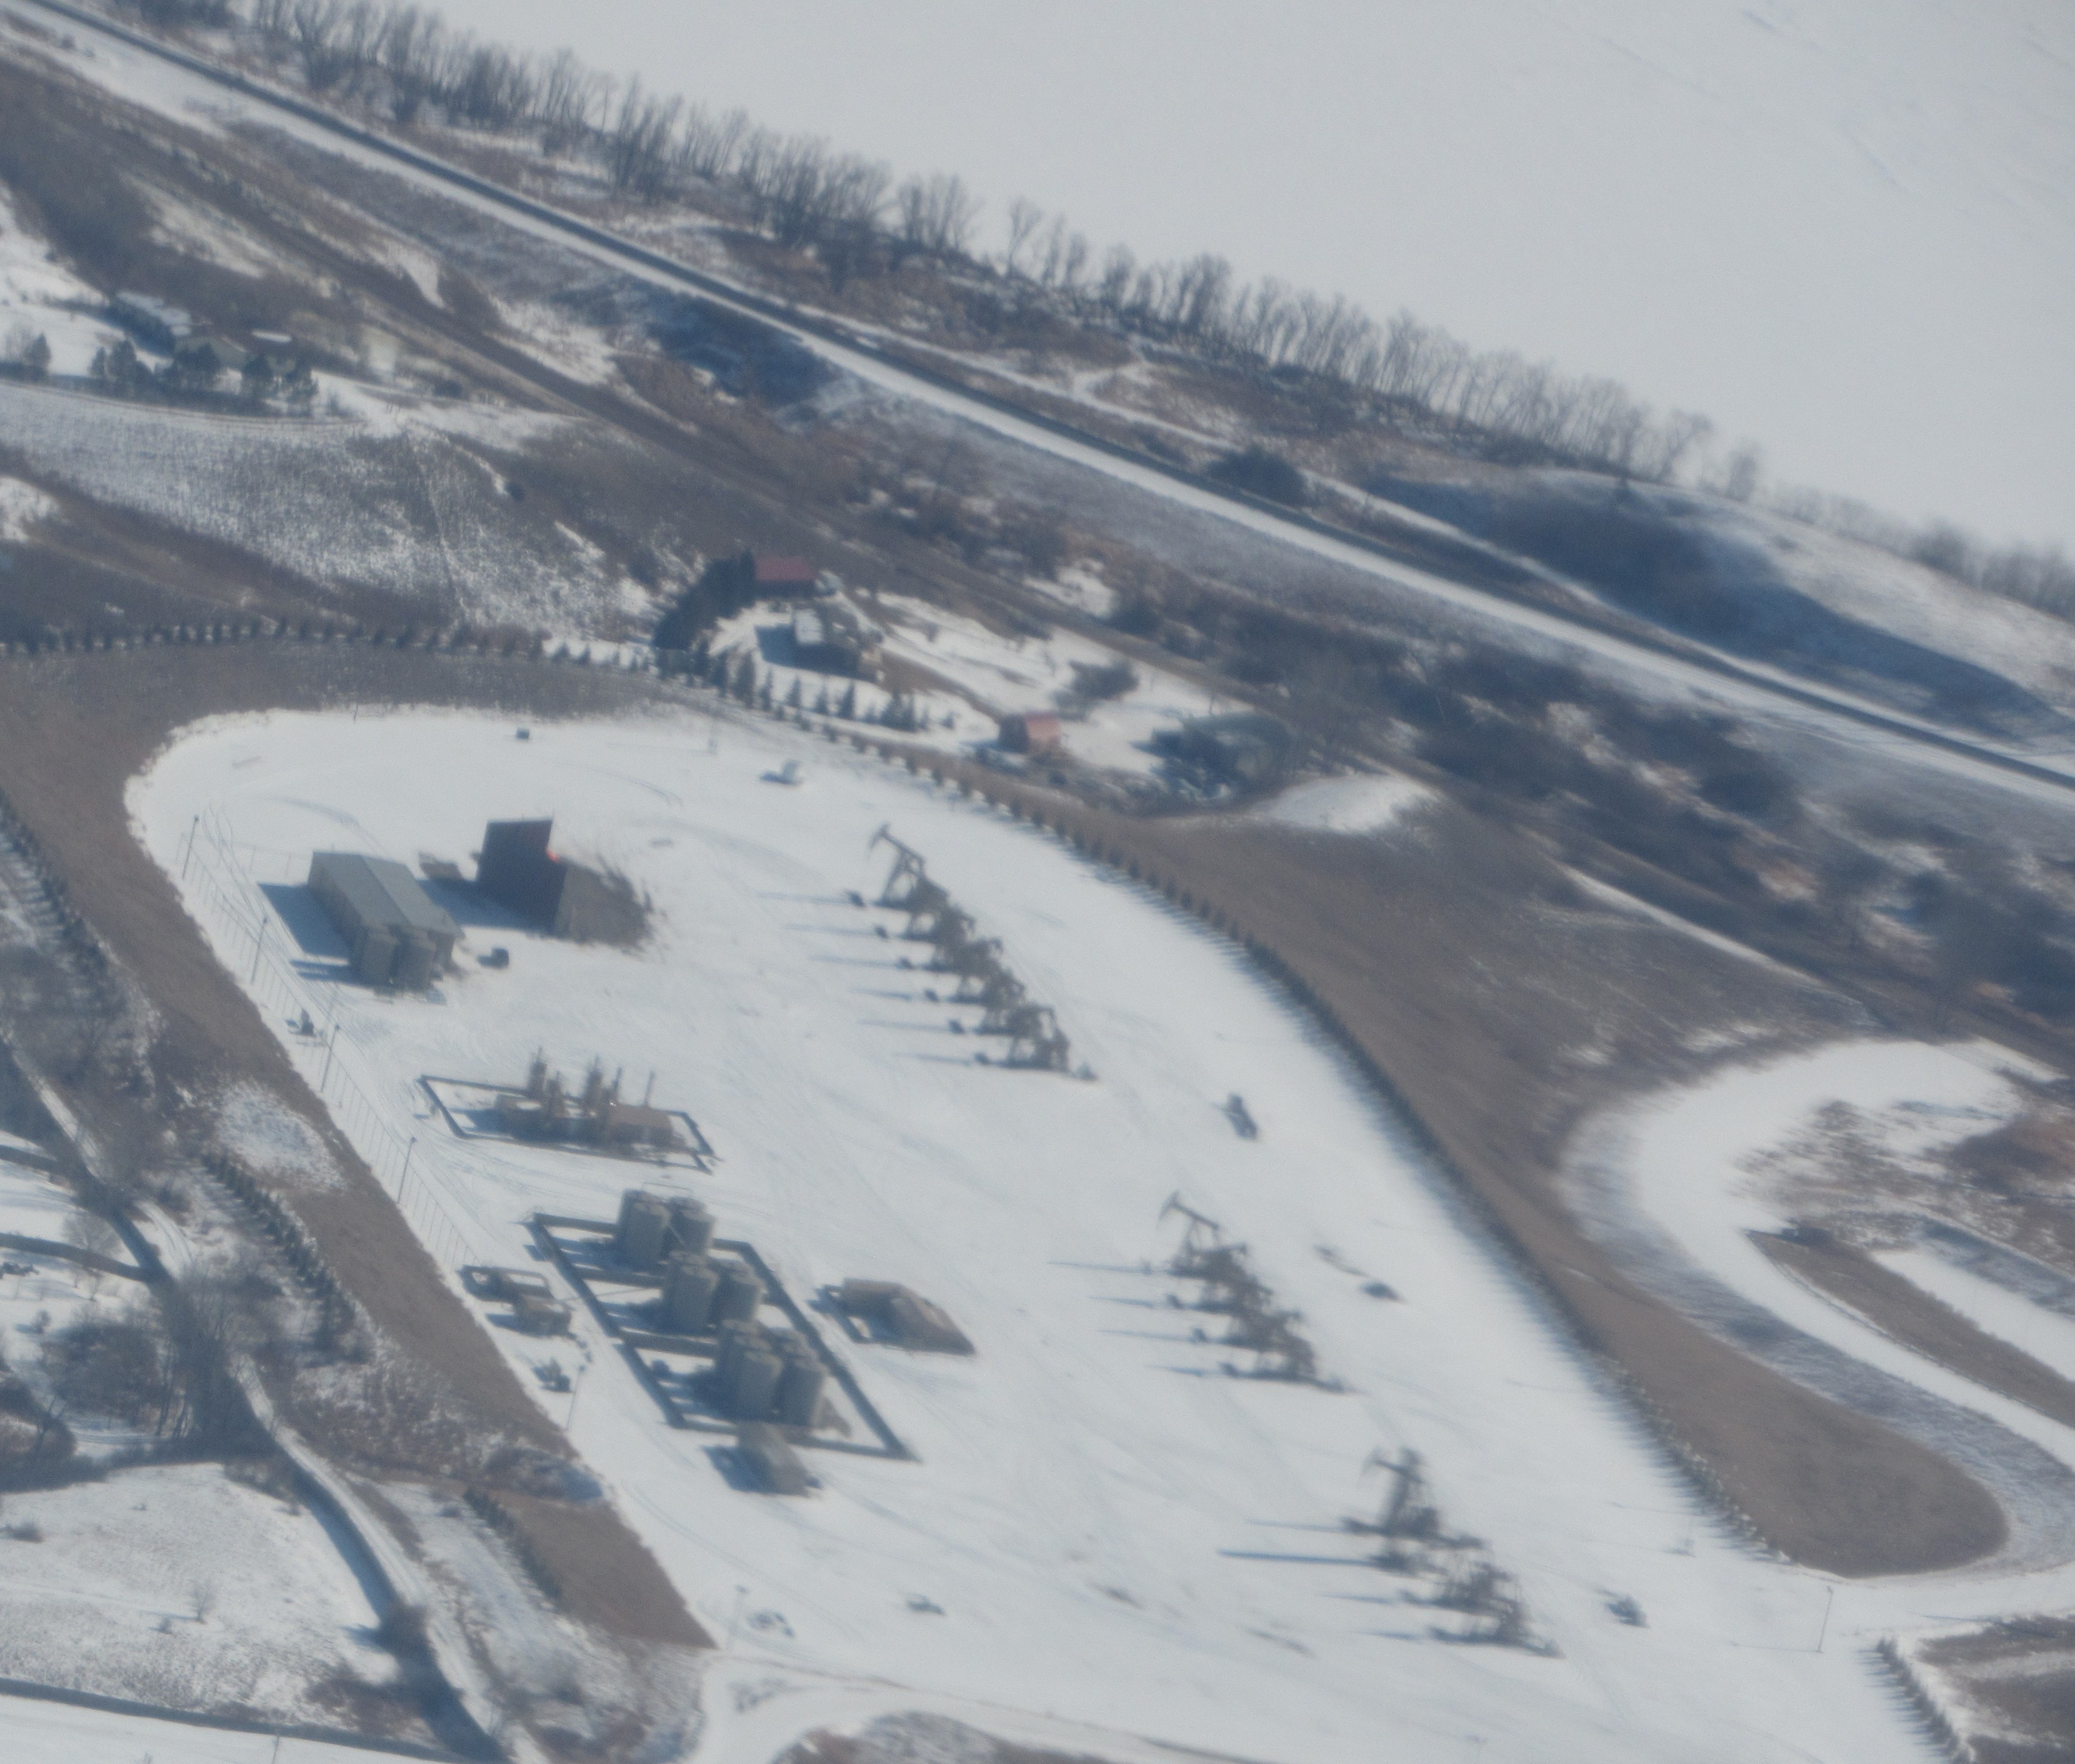
Oil pad with four wells; one with pumpjack and three without. Looks like there is room for another six or more wells eventually. Photo by James Ulvog.
Crude oil production hit yet another record level in October at 1,517,796 barrels of oil per day (BOPD) (preliminary). September was not a record at 1,443,980 BOPD (revised). September was only the third highest production.
During 2019, record level of production was hit in October, August, July, June, and January. Record was broken in 2018 during December, October, September, August, July, and May.
Huge amount of room on that site for additional wells. Already have two rows of wells. Photo by James Ulvog.
What does the average daily production trend look like? Check it out:
Crude oil production in North Dakota has broken a record for three months in a row. This is not a record breaking number of record breaking months though. In the post-bust time since 2014, the record number of record levels was July 2018 through October 2018, or four months in a row. Back then production was 1.27m bopd in 7/18, 1.29m, 1.36m, and 1.394m, before sliding a bit to 1.378m in 11/18.
Production was 1,477,394 bopd (preliminary) in August 2019, up 2.18% from 1,445,934 bopd in July.
Four of the reasons oil prices are *not* completely crazy after the attack on Saudi Arabia’s processing facilities this past weekend. Photo by James Ulvog.
In July, the state energy wizards set four record levels of production:
Crude oil
Gas
Barrels of oil equivalent (converting gas into equivalent amount of oil and combining with crude production)
Number of producing wells
Breaking production records in North Dakota, New Mexico, and Texas is something to celebrate if you like being able to get gasoline for your car whenever you feel like doing so, or if you like having gas available at reasonable prices in spite of when, oh, say, someone drops a bunch of bombs on Saudi production facilities.
Oil production in the state increased 2.15% in June, growing an average of 30,004 bopd, from 1,394,648 bopd average in May (revised) to 1,424,652 in June (preliminary). That is after a lull from October 2018 through May 2019, when the average production increased a mere 648 bopd.
Before showing the production graph, a few comments about prices and rigs in operation.
Prices have declined substantially in the last couple of months:
Sweet crude in North Dakota
$48.00 March
$52.50 April
$50.50 May
$43.10 June
The drop, especially in June, shows up in the value of crude production:
The productivity of wells has increased over the years. The result is the count of completed wells is largely independent of the number of drilling rigs in operation.
Consider an overlay of the completed well count and the rig count:
Oil production in North Dakota increased slightly to average of 1,393,284 BOPD in May 2019 (preliminary), up 799 BOPD from April (revised).
Rig count has been flat, ranging from low of 61 to high of 67 during the last 12 months.
An odd factor this month is small increase in production (up 799 bopd/day, 0.06%) with increase in producing wells of 194 (+1.26%).
Lynn Helms is cited in article at Bismarck Tribune (7/16/19 –Oil Production steady in May, but transportation woes persist) suggesting this is due to old legacy wells that produce around 25 barrels a day being closed in for the winter and then brought on-line from late spring until fall.
Economic driver explaining this is the costs of plowing roads and hauling oil makes such wells uneconomical in the winter. Thus they are taken off line in the winter.
The number of inactive wells dropped by 69 in May.
The two month changes are:
141 – drop in inactive wells
185 – well completions
337 – increase in producing well count
That leaves an increase of 11 producing wells that isn’t explained by drop in inactive wells and completions.
16 reasons US has been moving towards a net exporter of energy and finally hit that point. Well visible right of center with Missouri river in background. Williston, North Dakota. Photo by James Ulvog.
The changes in energy production over recent years is astounding.
My blogging has dropped off a lot over the last year or so due to distractions. Have a huge backlog of things to discuss, such as:
The US is a net oil exporter
Oil production in US is at all time record high
Sometime later this year the US will be exporting more oil product than Saudia Arabia
Record high level of oil production in the state was 1,403,844 barrels of oil per day (bopd) in January 2019. April production averaged 1,391,188 bopd (preliminary).
Before the slump in prices and drilling, the record high was 1,229.572 bopd in December 2014.
Since production bottomed out at an average of 942,322 bopd in December 2016, production has been climbing.
Production in June 2018 and every month since then has been above the December 2014 level. Even with winter weather, production has been in the neighborhood of the 1.4M bopd level for the last eight months, apart from small drop in February.
Graph of average production in the state and Bakken formation since 2008:
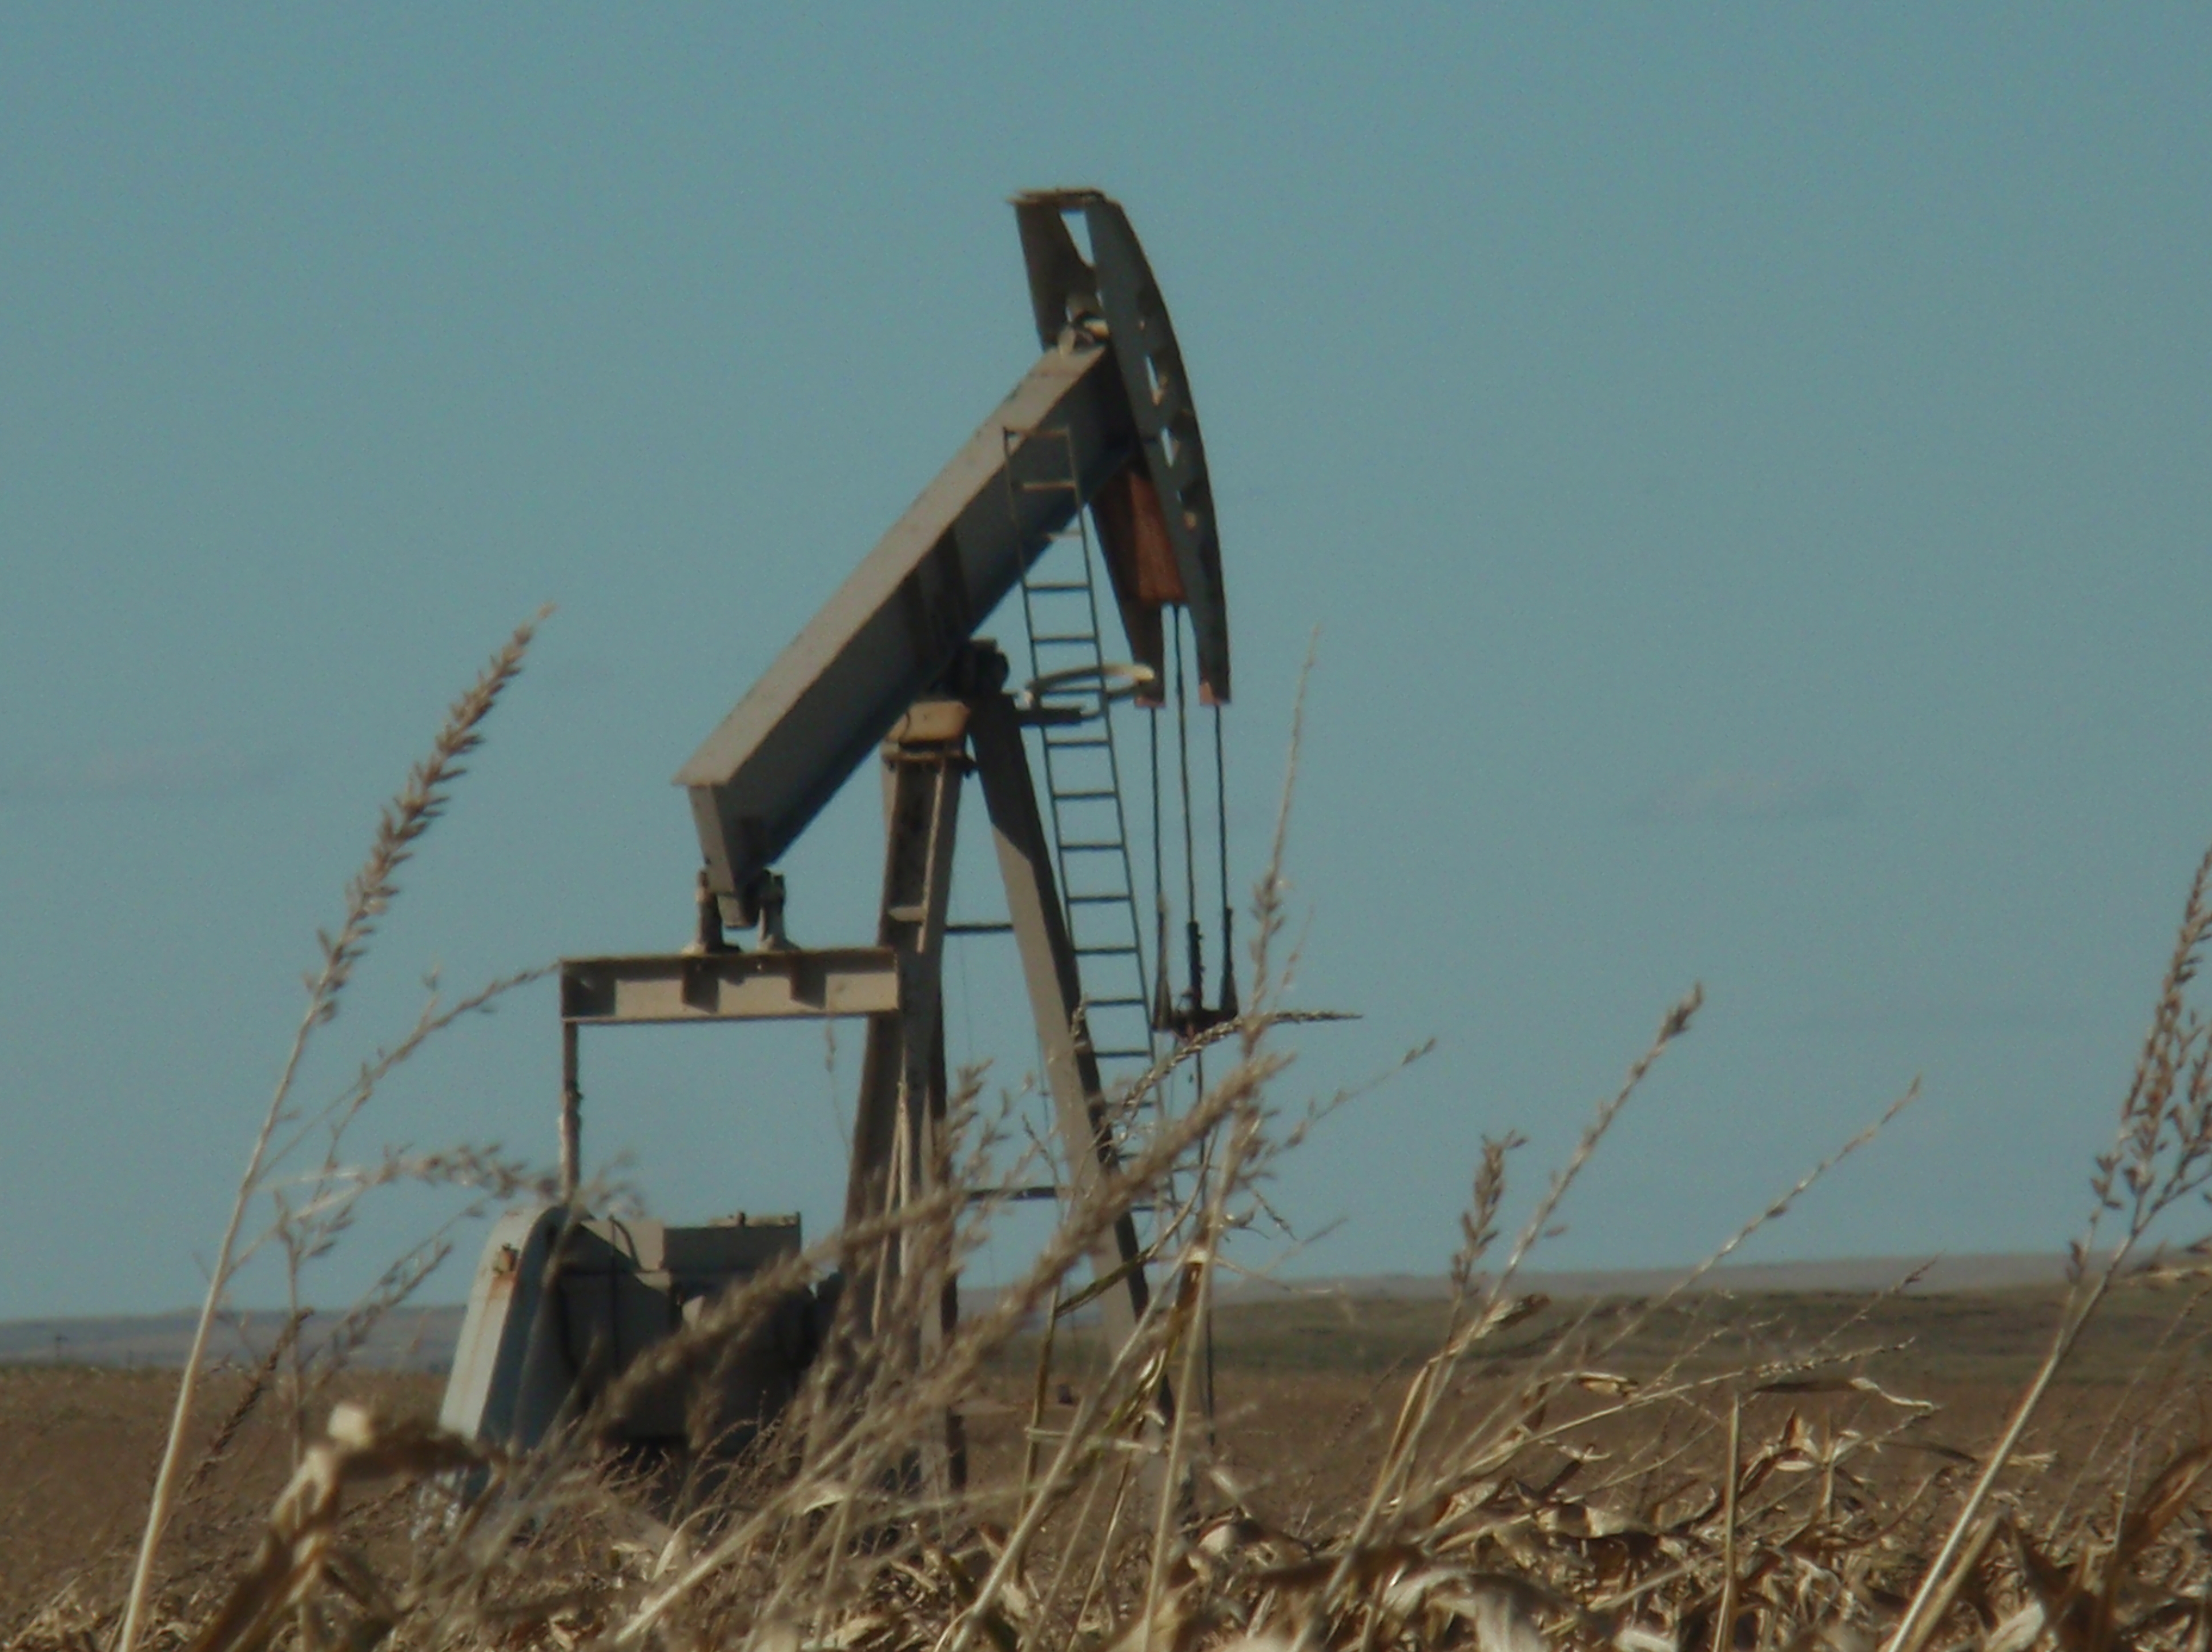
There is another pumpjack to the right of the most visible one. There are two more on the distant horizon. Photo by James Ulvog.
Preliminary production in January is 339 barrels a day below the revised amount for December. Here is how close January’s output came to the record high in December:
1,402,741 – December 2018 – record high
1,402,402 – January 2019 – preliminary
Production data usually changes in the month following initial release. The pattern I’ve noticed is a data for a well or three arrives after the cutoff for the monthly report. So, late reporting for a few wells could push the January 2019 data into record territory.
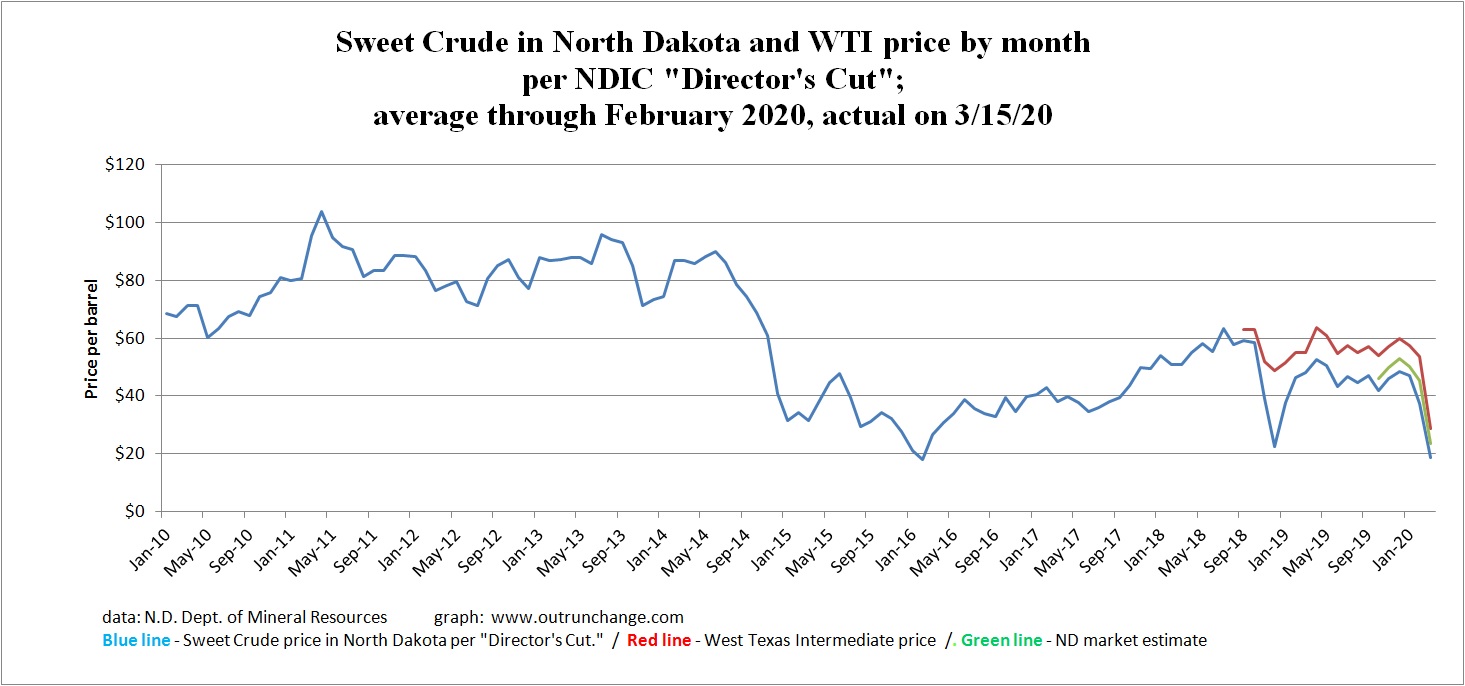
Before showing a graph of production, wanted to bring in some new data reported by the state regulator. The “Director’s Report” lists the average price for sweet crude in the state and has done so for many years. The report just started listing the average of West Texas Intermediate (WTI) pricing for the month.
There is a discount from the price realized in North Dakota compared to WTI because of the cost of transport. That spread, so I understand, has fallen since the DAPL was completed. Here is a revised graph of average price in ND to include an average of WTI:
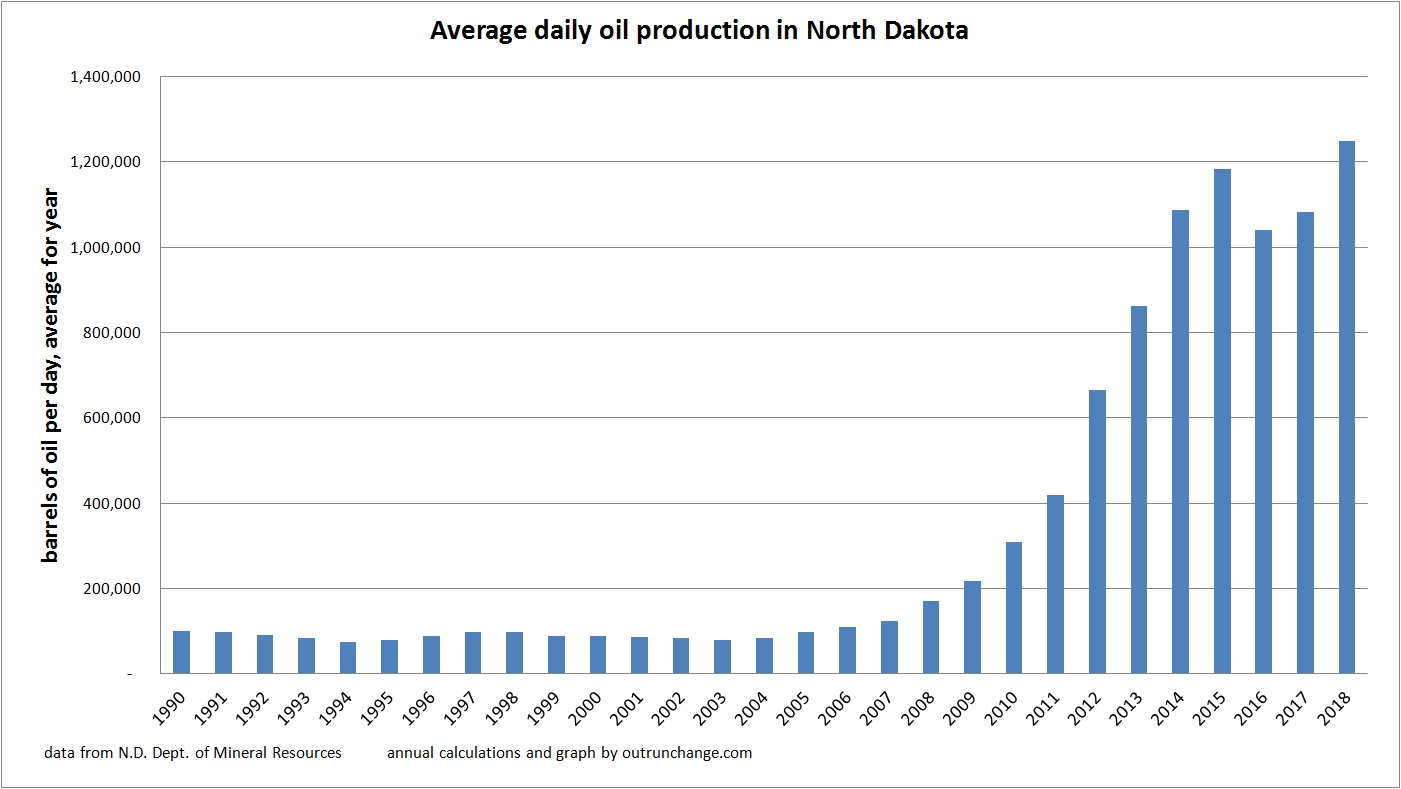
Total production of oil in North Dakota in 2018 set a record as did the average daily production. Prices have recovered from their low which means the value of that production is going up but not yet close to setting a record.
All of the following data is from a spreadsheet I maintain, with the raw data pulled from various reports published by the North Dakota Department of Mineral Resources.
Average daily production rose to 1,249,049 bopd in 2018, up from 1,081,543 bopd in 2017. That is an increase of 167,505 bopd, or 15.5%. Previous record was 1,184,009 bopd in 2015.
Average daily production:
Total production for the year was 455,902,738 barrels, an increase of 61.1M barrels over the 394.8M produced in 2017.