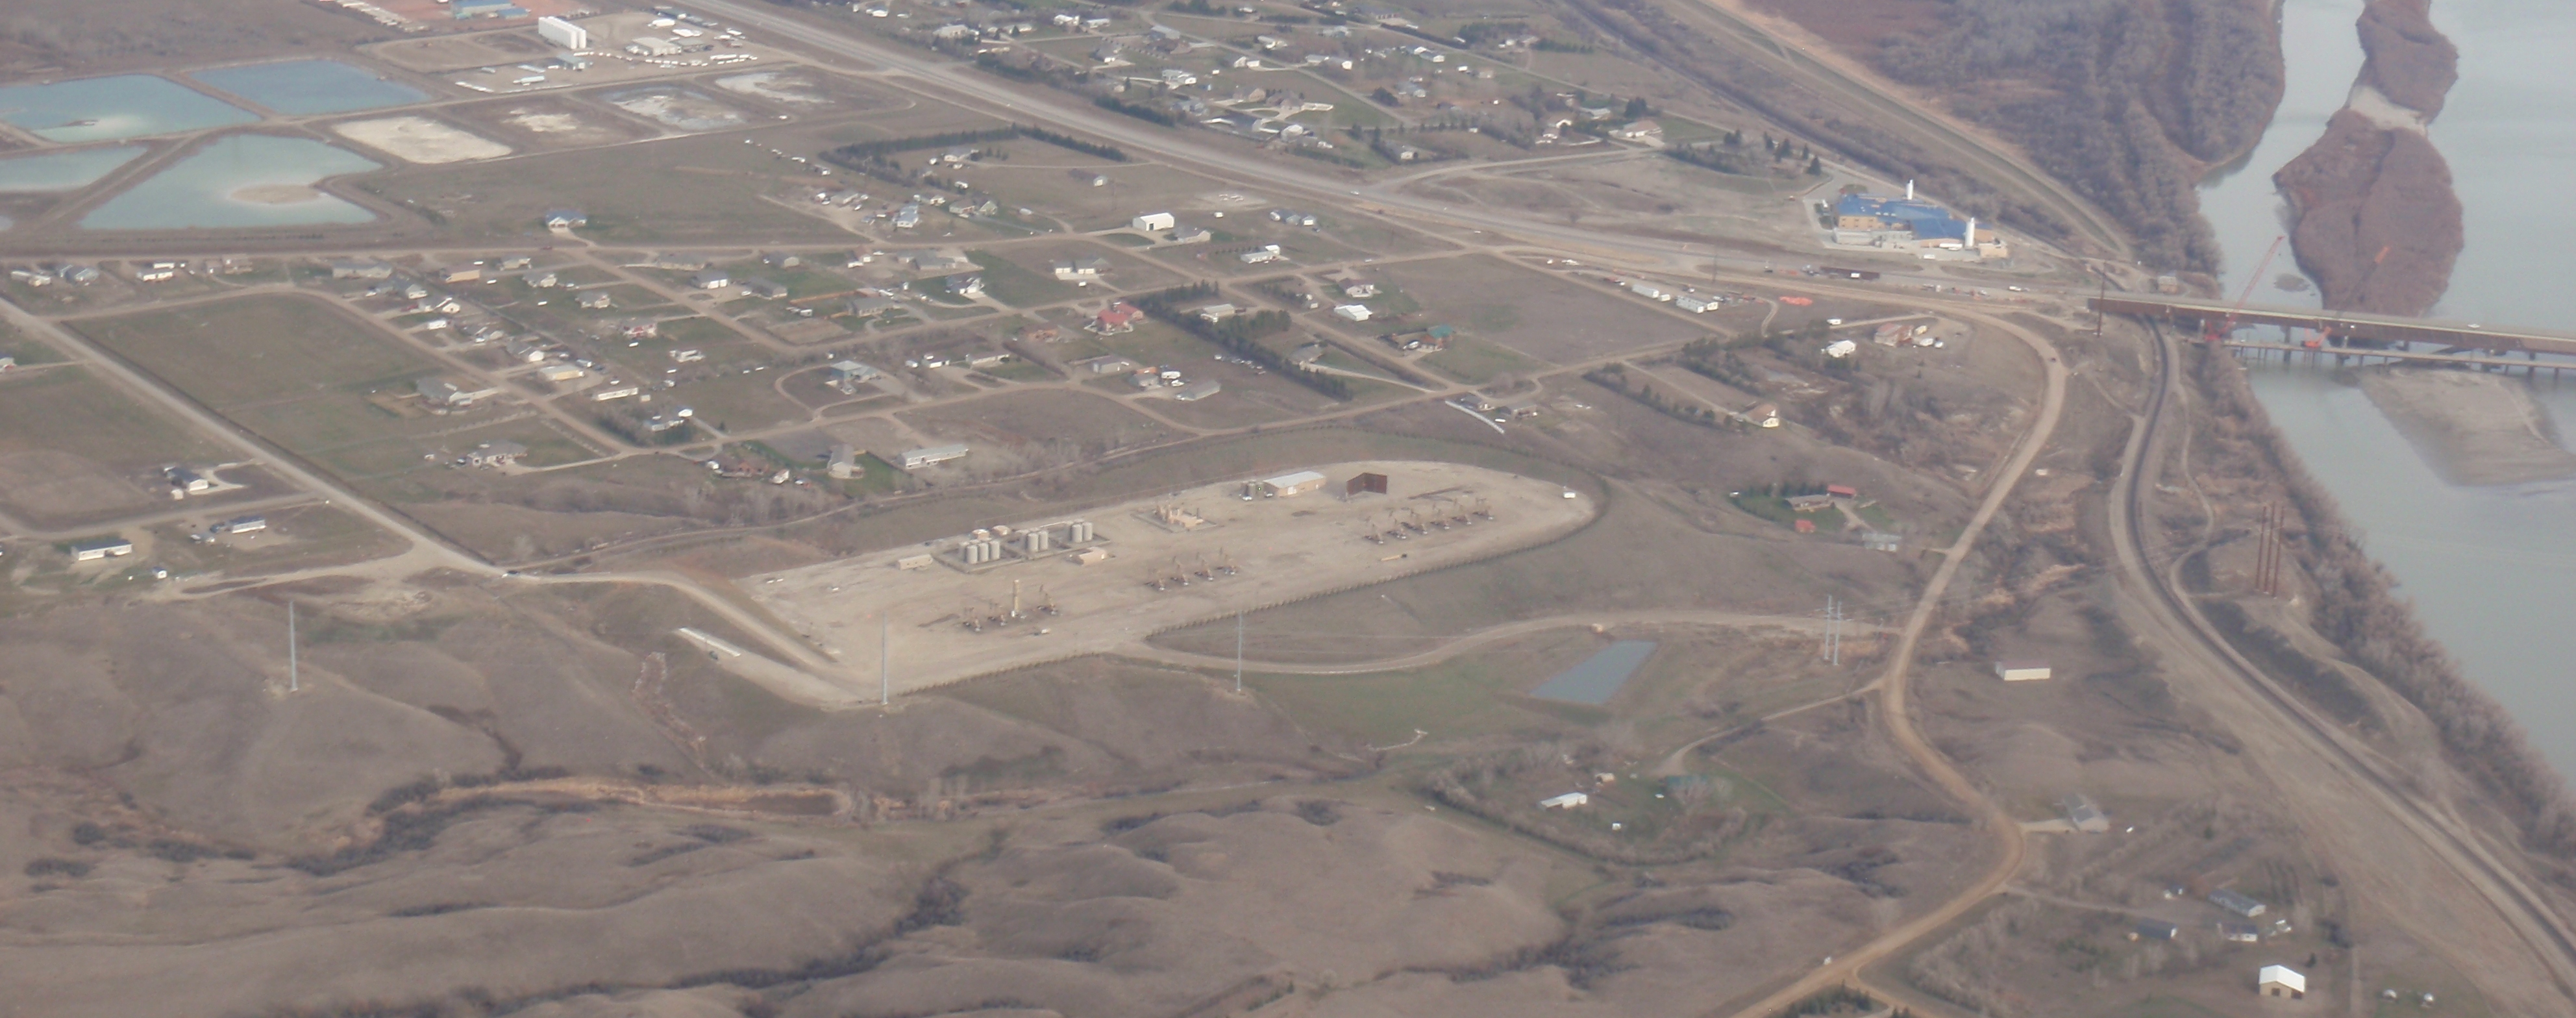
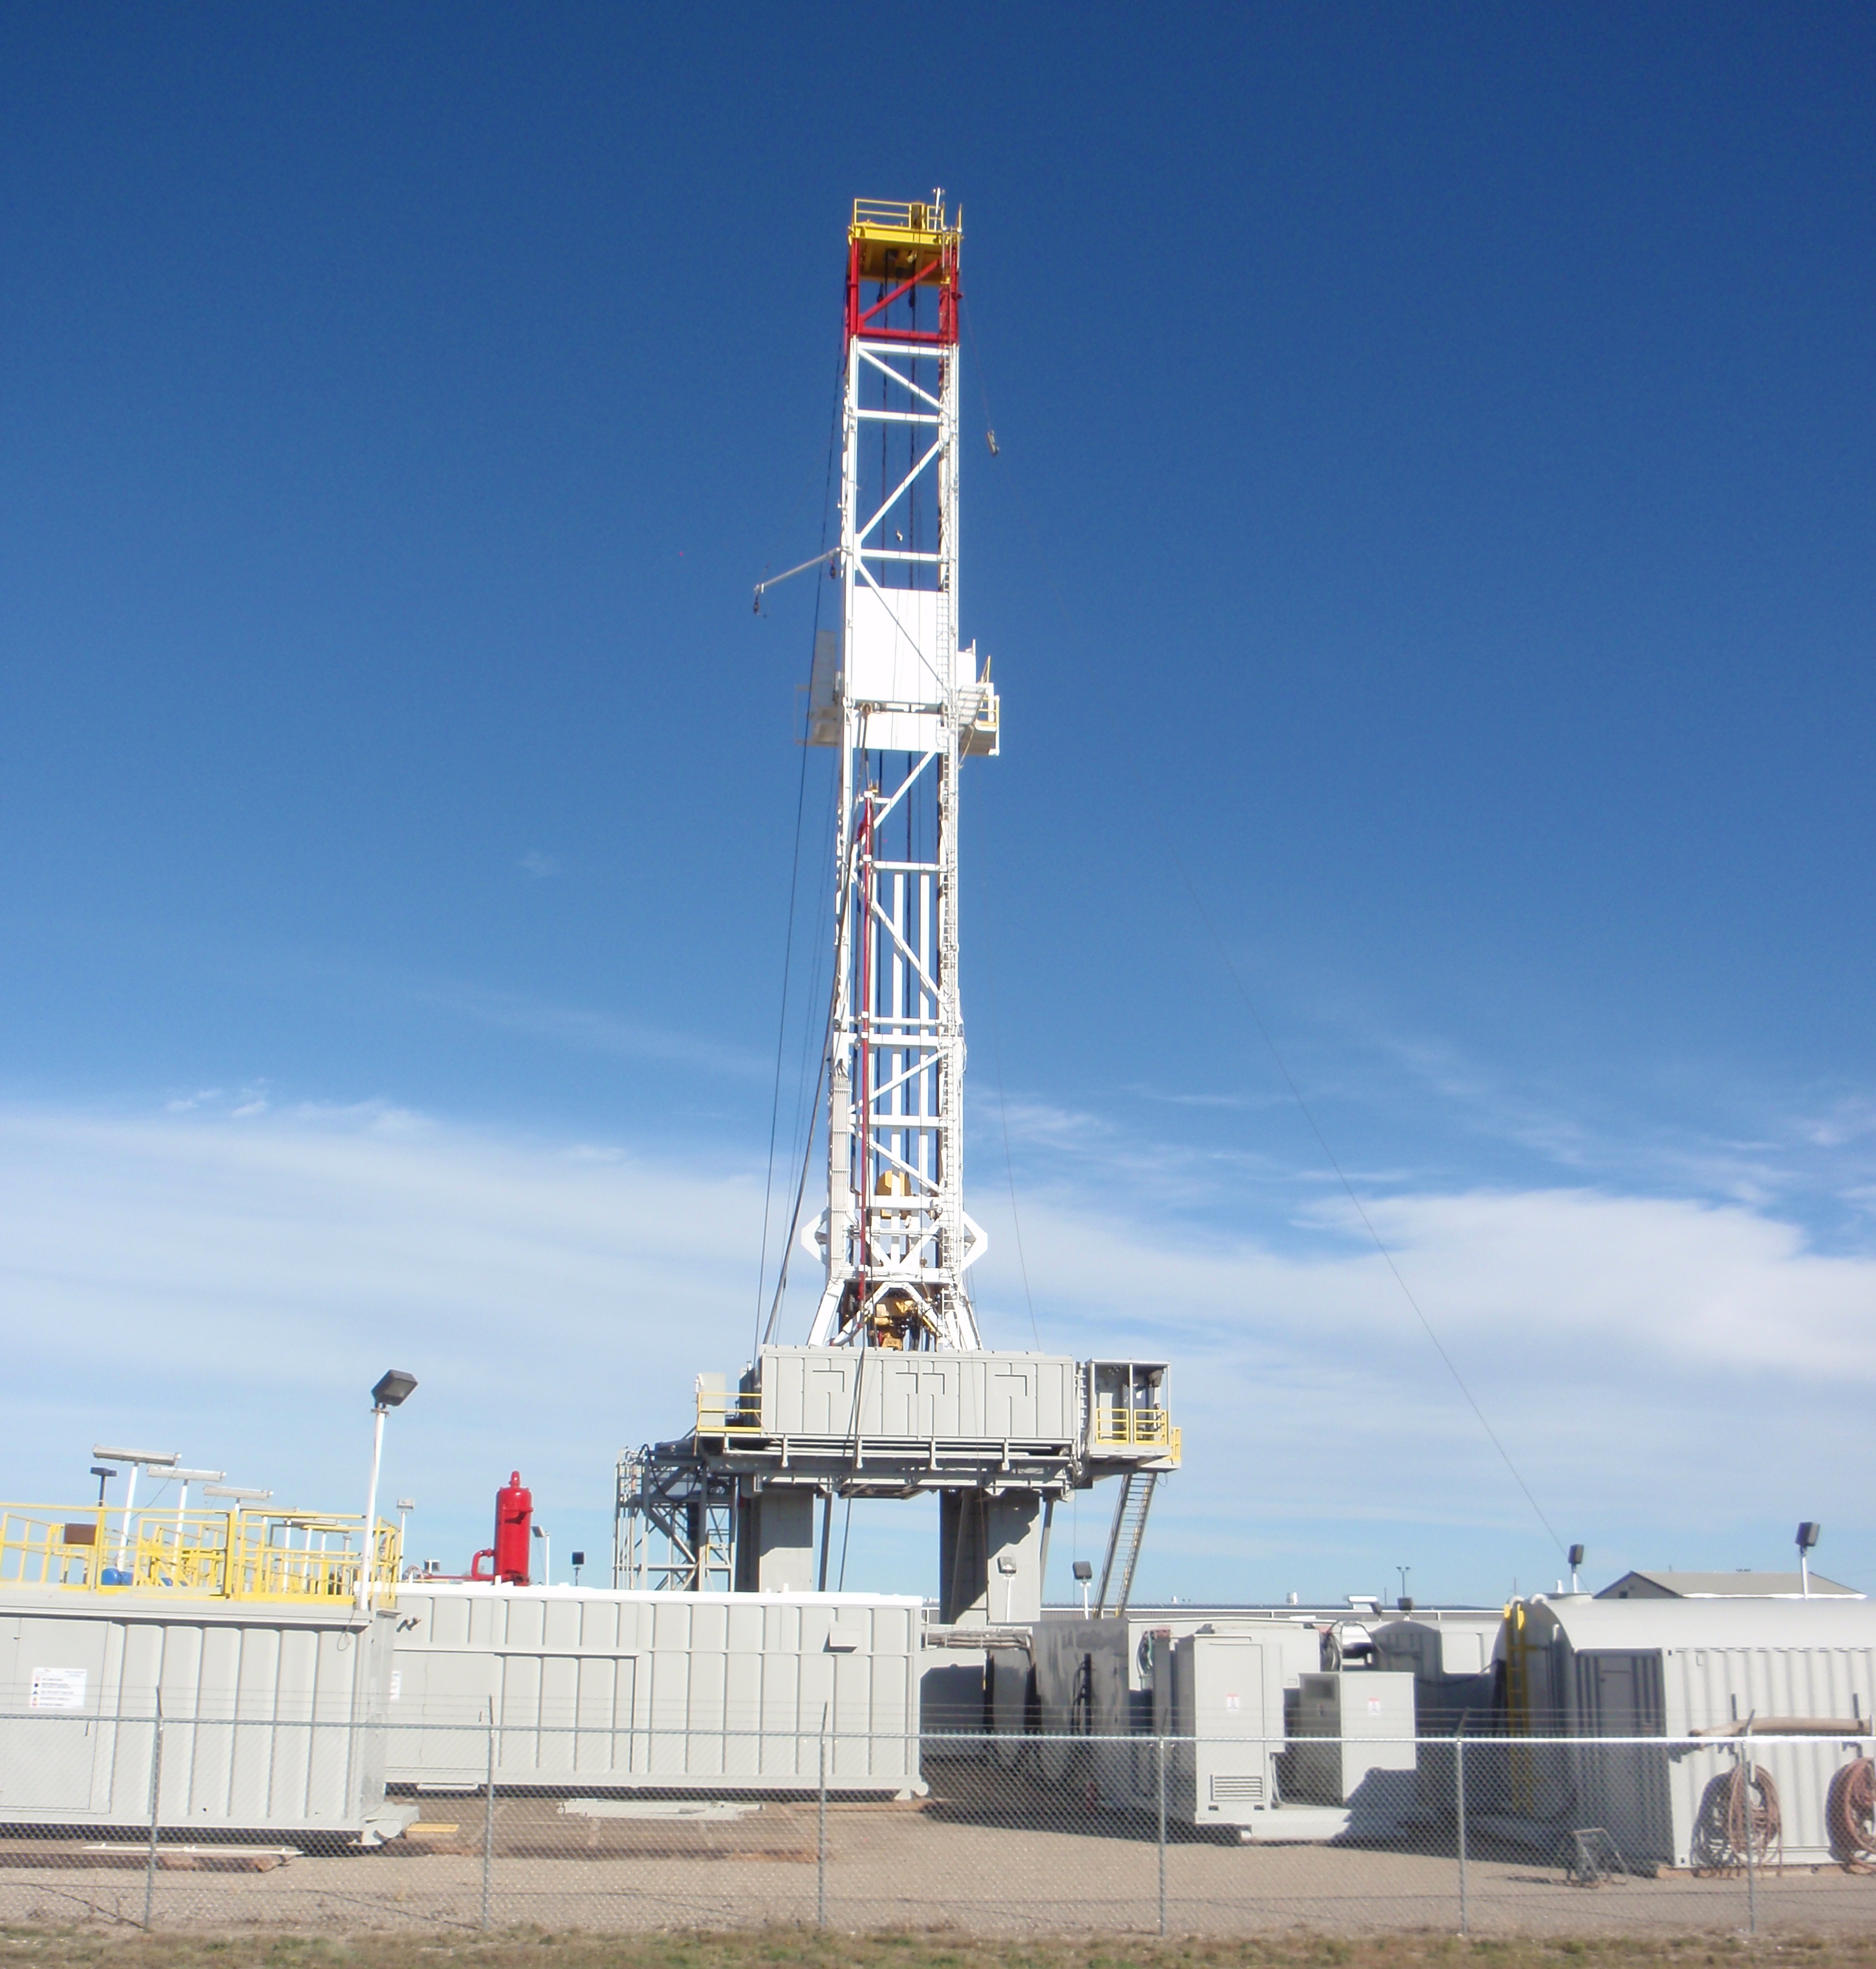
Based on the number of storage tanks on that pad, I’ll guess there will be a lot more than 2 wells operating on that site in a few years. Photo by James Ulvog.
Production of crude oil in the state rose to 1,085,690 bopd in August, an increase of 36,591 bopd from the updated production of 1,048,099 bopd in July. That is a 3.49% increase.
For context, that is the highest daily production since March 2016. On the front end of the boom, production did not rise to that level until June 2014.
The Williston Herald reports comments from Mr. Helms: Rigs moving away from Bakken’s core, but gas production still hits new high. Rigs are being deployed outside the core area of Bakken, away from the best sweet spots. I’m not sure what that means, but will guess it is an indication that drillers are more confident that prices will stay roughly where they are now or better.
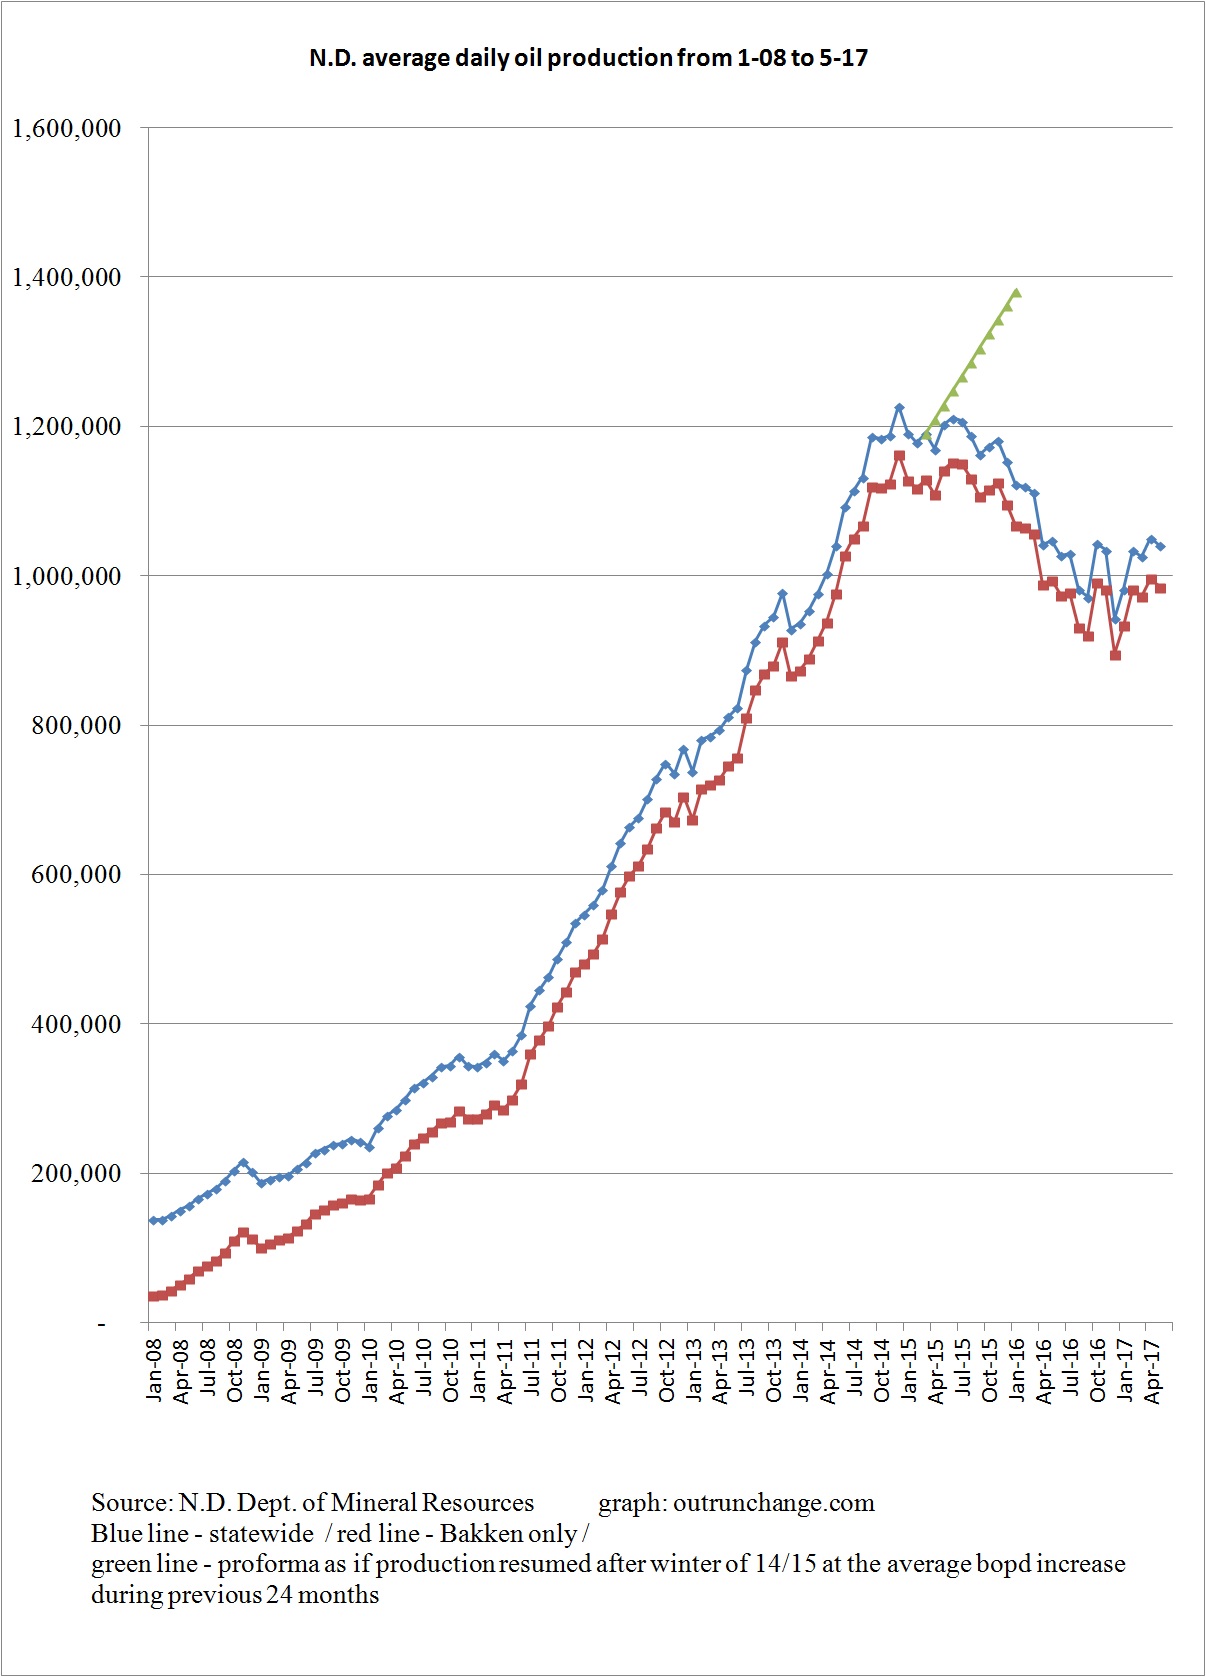
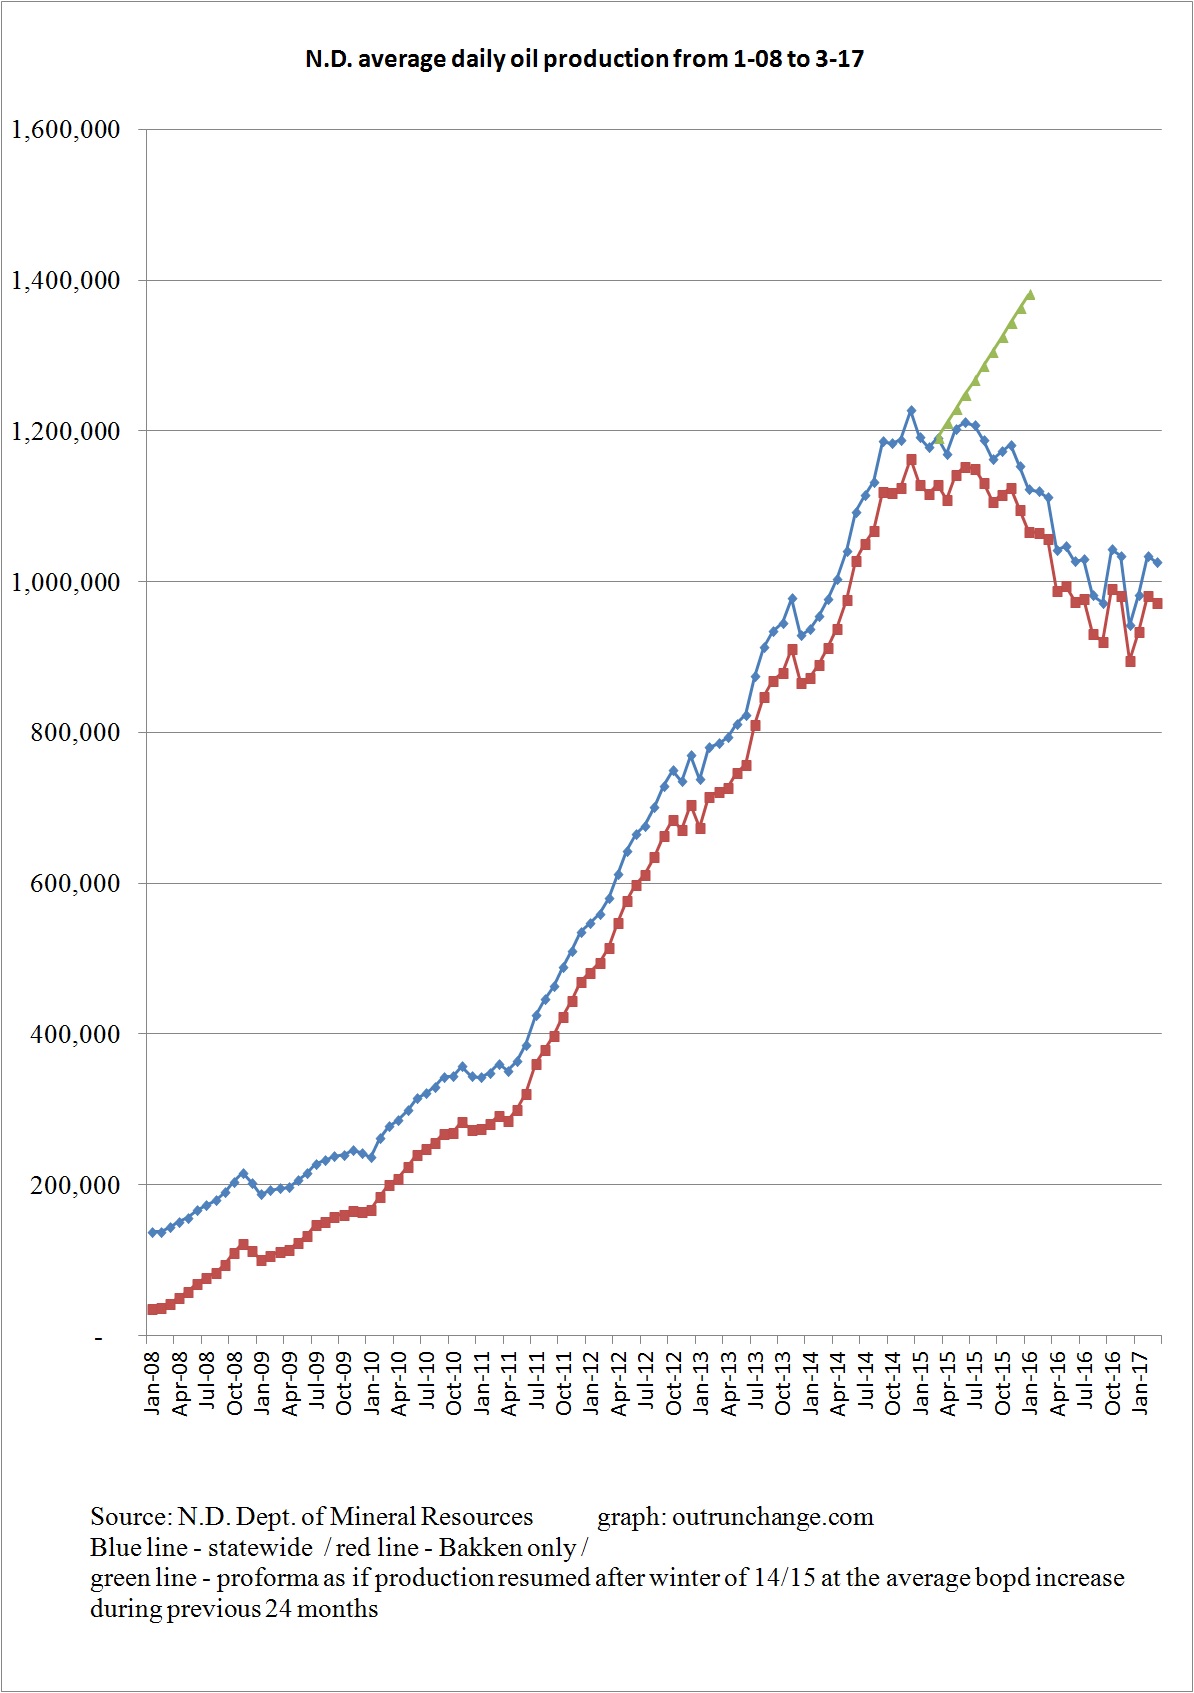
Here is a graph of crude produced in the state and from the Bakken formation (along with Three Forks):
In a webinar, Lynn Helms, director of the Department of Mineral Resources said with oil prices, rig count, and number of fracked crews at the current stable level, the production will remain at 1 million a day. He calls it a “soft landing”.
He said production is somewhere in the range of 5% or 6% above the level built into the state revenue forecast. Prices are about 9% below what is built into the budget.
He indicated the consensus is that if the price of West Texas Intermediate goes above $50 there will be increased activity in drilling and completion.
Article provides insight on hydraulic fracturing. There are currently enough crews in place to keep up with the wells drilled by the current count of 56 rigs. Mr. Helms thinks if prices are in the $50-$60 range there will be six more fracking crews put in the field to supplement the 25 currently in place. That will reduce the fracklog.
A fracking crew has somewhere between 45 and 65 staff.
Oil production in the state dropped about 1% in May, falling from average of 1,050,476 bopd in April (final) to 1,040,131 bopd in May (preliminary) That is a drop of 10,345 bopd for the month.
Article also points out it will take another month to see what impact DAPL will having on the amount of oil shipped by rail. This is a big deal on the revenue realized by producers.
The spread between West Texas Intermediate and what Bakken producers get is about $11 a barrel. That is the cost of transport. The spread is expected to be $6 or $7 for oil shipped through DAPL.
Here are a few graphs to tell the production story:
Average production for state and Bakken only:
Value of monthly production, which seems to have stabilized in the last six months or so:
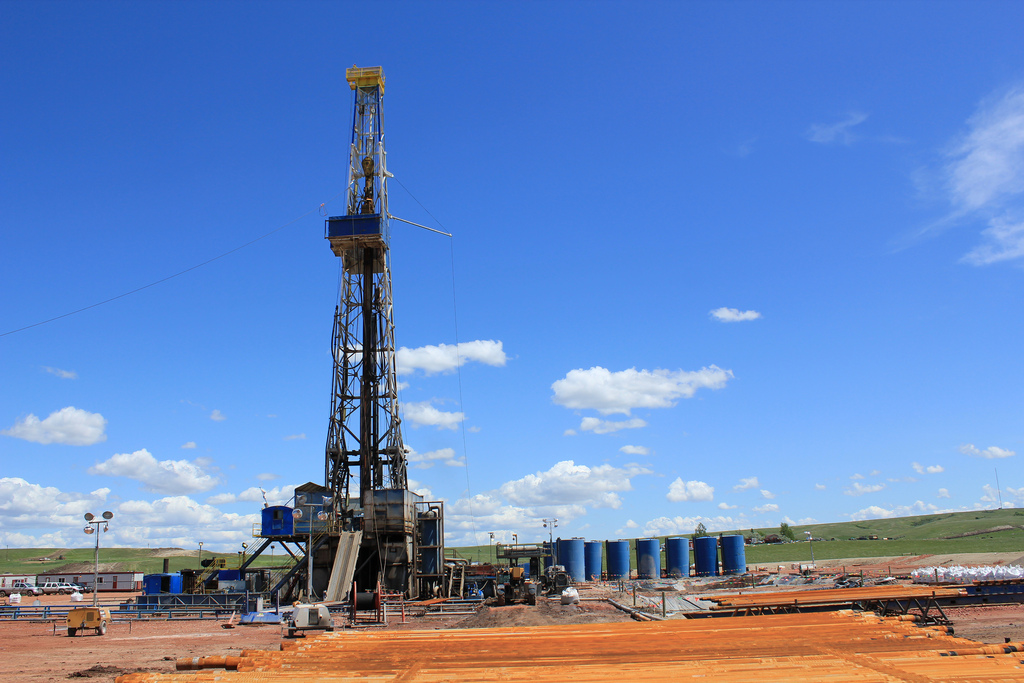
Wells being drilled by that rig have long since gone into operation and contributed their share to increased US production.
The impact of fracking is massive. Large increases in production of natural gas and crude oil has created a long list of favorable economic and environment impacts.
7/6/17 – Victor Davis Hanson at National Review – The Fracking Industry Deserves Our Gratitude– Prof. Hanson provides a fast survey of how much fracking has improved the American economy. Fracking is the combination of horizontal drilling with hydraulic fracturing.
The impact of fracking is staggering.
Ten years ago eeeeeeverybody knew for an absolute certainty that Peak Oil was here and we were about to run out of oil. The Secretary of Energy was wishfully musing that gasoline would rise from $4 to $10 a gallon.
In the last five years, gasoline prices are down about $1.50 a gallon, surge in natural gas production displaced coal consumption which has reduced our CO2 output by 12% in the last decade (surpassing the EU in cuts), and reduced our oil imports by five million barrels a day.
6/3/17 – Star Tribune – North Dakota oil industry shows signs of a rebound – Drilling and employment is picking up in the North Dakota oil patch. Article illustrates this by telling the tale of several guys who have been out of work for a while but have been rehired.
Several analysts are quoted saying the industry is bouncing back.
Interesting stats in the article:
An oil rig is 13 stories tall, weighs 275 tons, and costs somewhere between $50,000 and $70,000 per day to operate.
Rig count: 51 now, 218 at high point in December 2012, 27 at low point in May 2016.
Oilfield employment in the state is 16,400 in April 2017, which is up 10% over same month in 2016.
Online postings for open jobs were at the highest in April over the last year and are up 94% from prior year. A trade group representative says there are likely 1,000 open oil jobs in western North Dakota.
Total production in Bakken is down 1.5% in the last 12 months. Meanwhile production in the Permian basin is up 25% in the last year.
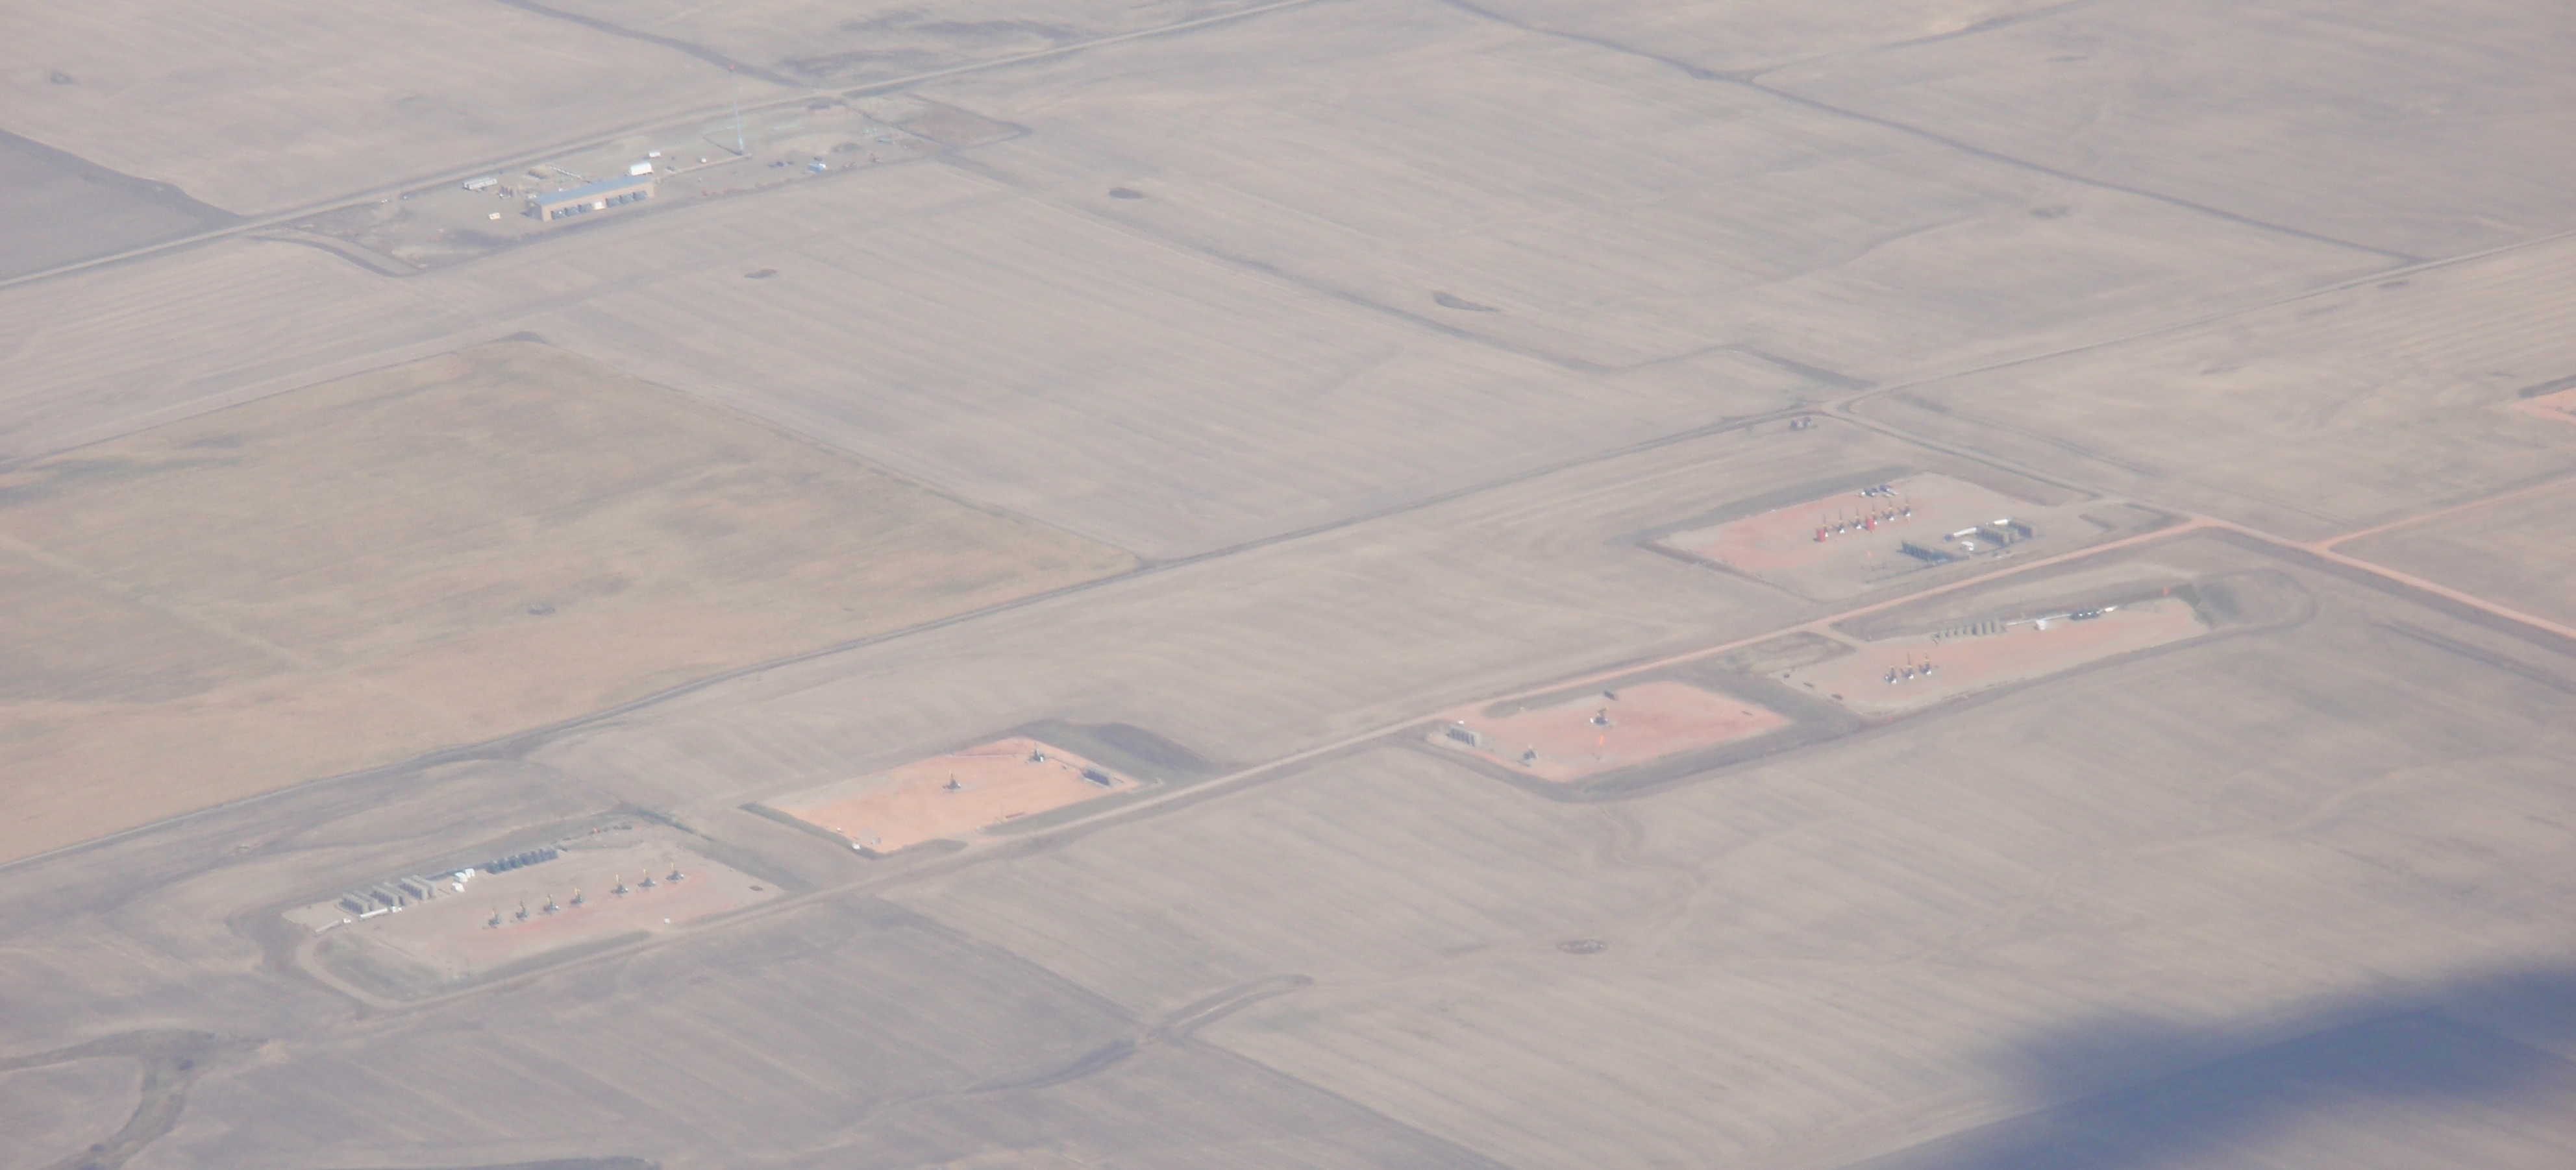
Those five pads have 7, 1, 2, 3, and 6 wells. I’ll guess each pad will eventually have about 7 or 8 wells. That would be about 40 reasons OPEC+Russia had no choice but to extend production cuts. Photo by James Ulvog.
I don’t publish more than one post a day anymore, but with the following headline showing up today, gotta’ run another:
Article says this has strengthened the relationship between Saudi Arabia and Russia, the worlds’ two largest oil producers.
The combined cuts for all the participants is around 1.8B bopd down from a year ago.
Article points out the obvious: OPEC+Russia had no choice but continue the cuts. If they didn’t, the extra oil would further drive down oil prices. Their production cut hasn’t actually succeeded in pulling prices up where they wanted, but the alternative would have been even lower prices.
Shipwreck standing on the beach with the sea in the background. Margarita Island. Venezuela. Photo courtesy of DollarPhotoClub.com
Devastation in the oil industry and food supply chain in Venezuela is due to intentional government policies.
One article sees how the government caused the damage to the oil industry while another article sees the devastation in the food supply but cannot see any direct cause.
5/7/17 – Forbes – How Venezuela Ruined Its Oil Industry – Here is a primer on how to destroy your oil industry when you have the world’s largest proven reserves of oil and are in the top 10 of world oil producers.
If you want to destroy your country, the article provides a how-to-guide, using Venezuela as the road map.
The high point of oil production in Venezuela was 3.5M bopd back in 1998, which not by coincidence was the year Hugo Chavez became president. Production then began to slip. How could that be?
After civil unrest in 2002 and 2003, Chavez fired much of the staff of the national oil company, letting go 19,000 experienced staff.
Let me translate that: 19,000 staff who knew how to produce extra-heavy oil were fired and replaced by people whose primary job skill was loyalty to the president.
Extra heavy oil takes specialized knowledge and is very expensive to produce on top of oil production already being capital-intensive.
To generate more revenue, Venezuela invited five of the oil majors to develop more oil production. The form of investment was a partnership. The five majors invested many billions of dollars in oil production.
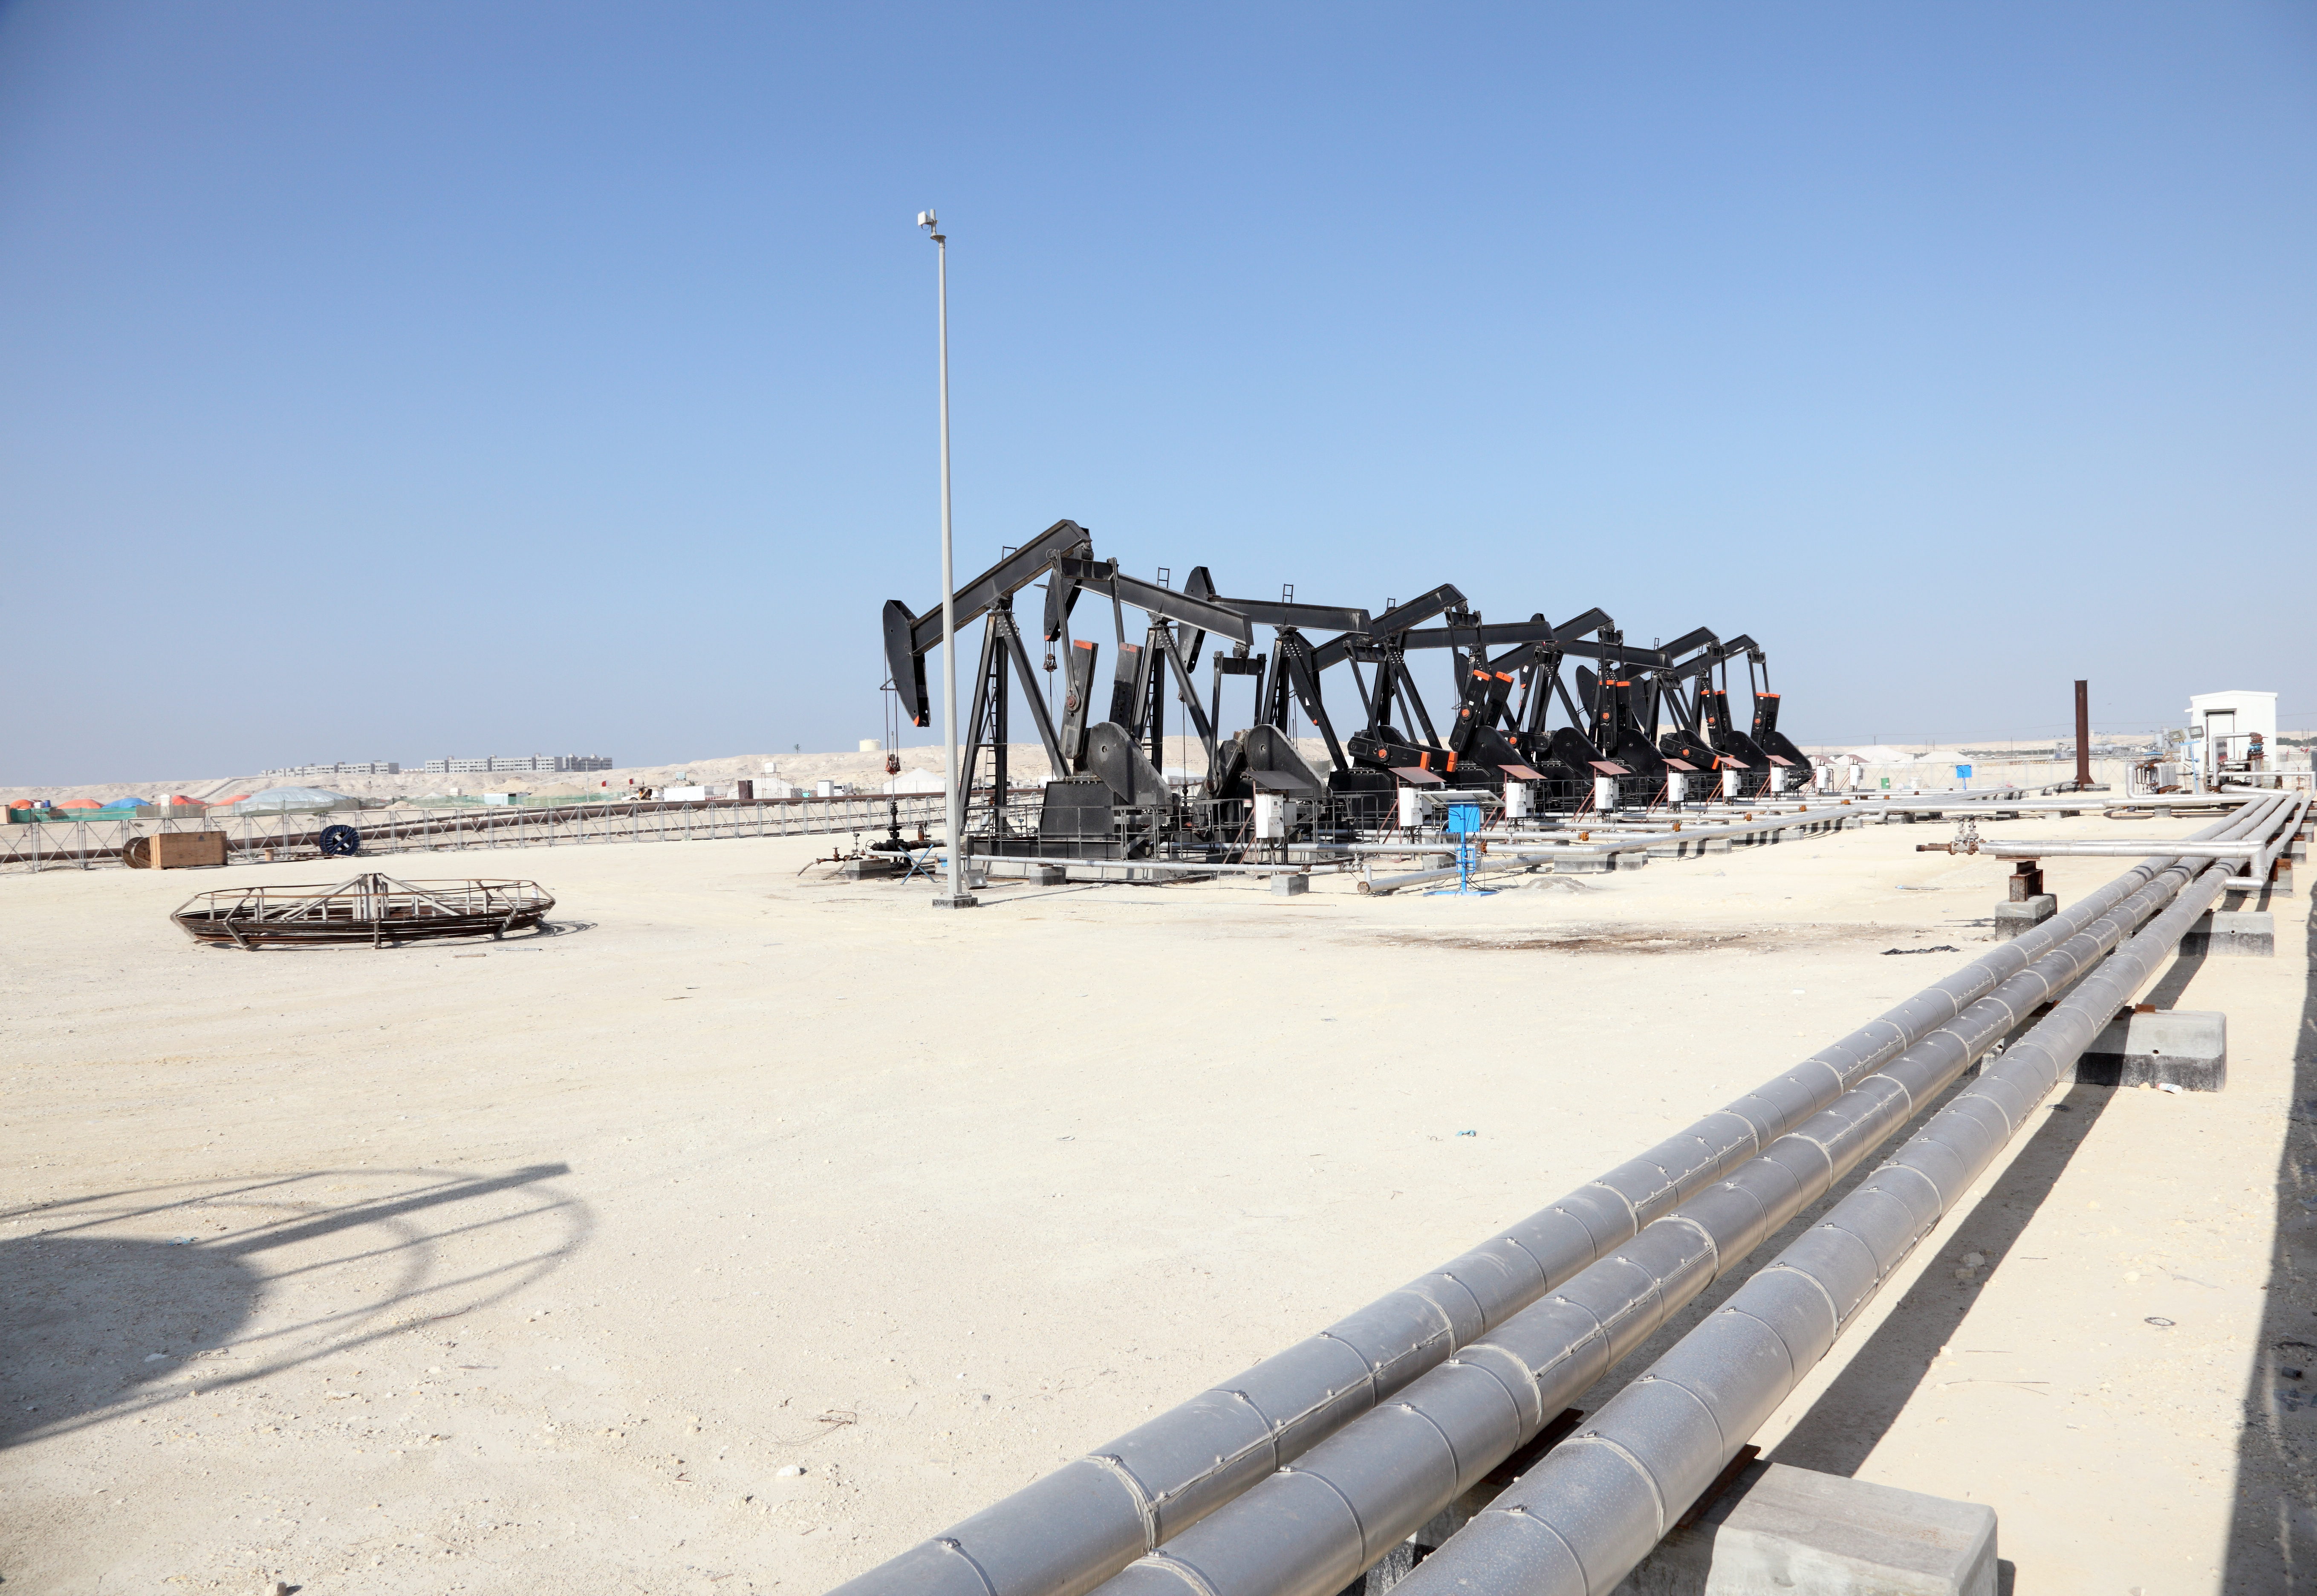
How much oil to pump? Oil pump jacks in the desert of Bahrain, Middle East. Photo courtesy of Adobe Stock.
Lots of articles lately describing what is going on in the oil market. If you are a consumer, the news is rather good. If you are a part of OPEC, the news is quite grim. If you are a U.S. producer, there is a lot of opportunity.
5/17/17 – Daniel Yergin at Wall Street Journal – The Struggle Behind Oil’s Ups and Downs – Another must read, but then anything Mr. Yergin writes is in that category.
Here is my feeble try at a summary:
Mr. Yergin sees two forces at play in the oil market.
First is the pressure to balance supply and demand. US shale producers increased production a lot in 2014 which created an imbalance in the supply, which pushed prices down. Instead of dropping production to maintain prices, Saudi Arabia increased production, which further oversupplied the market and caused prices to collapse.
When prices dropped further than expected, the Saudis worked out a deal to cut production last November. That brought prices up.
In turn, that motivated shale producers to increase drilling, which is increasing US production, which will put more US shale oil on the market than expected, which will put substantial downward pressure on prices later this year.
Second is the recalibration of technology and internal pricing to reduce the cost of production. The innovation and efficiency gains in the last two years are remarkable.
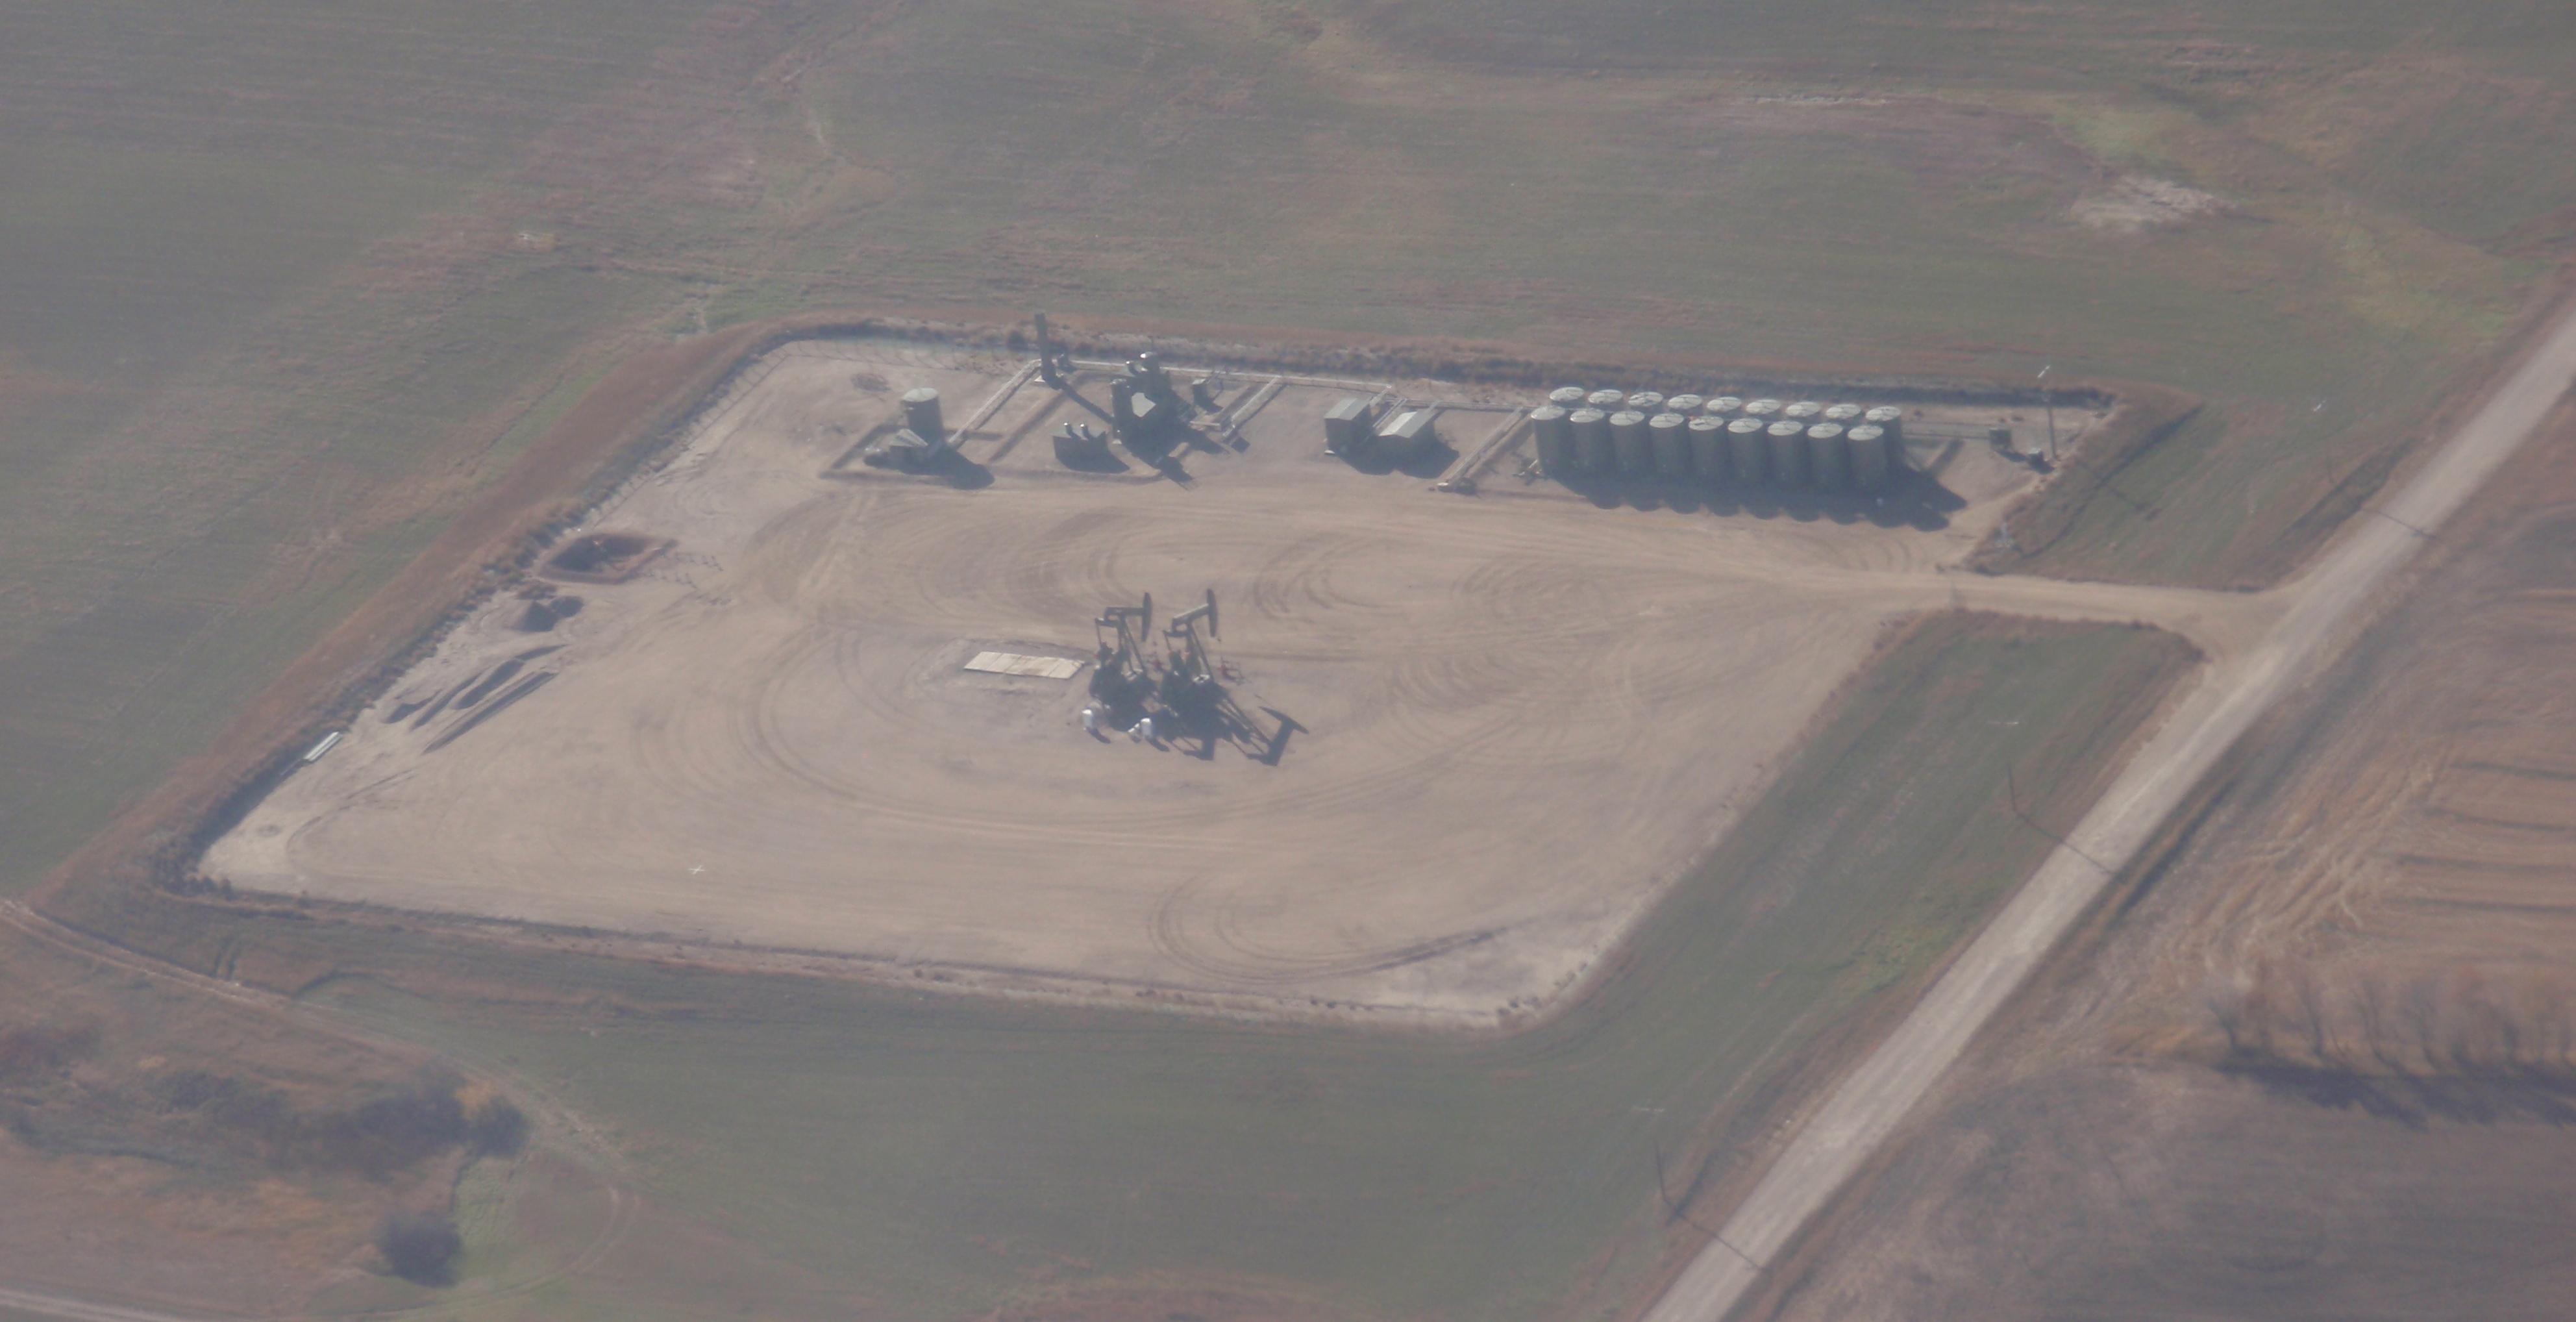
Another dozen reasons OPEC is in distress. Two reasons are quite visible. Another 10 reasons are the open spaces on that large pad where additional wells are going to be drilled someday. Notice the large number of storage tanks, which is far more than what’s needed for just 2 wells. Photo by James Ulvog.
Here is a variety of news tidbits I’ve noticed lately from Bakken:
airport construction underway
lots more jobs opening up
EURs now in range of a million barrels of oil
oil starts flowing through DAPL
frac sand mines running full steam ahead
4/14/17 – The Million Dollar Way – New Airport Work to Begin Next Week– Official groundbreaking ceremony was in October 2016. The start of massive grading and site work starts the week of April 17, 2017.
Average daily oil production dropped 0.83% in March, from 1,034,248 bopd (revised) to 1,025,638 bopd (preliminary). Director’s report for the month is not out as of the time of posting this discussion. This month, I’ll just show two graphs of production:
14 wells on one pad. That would be 14 of the thousands of reasons OPEC is in distress. Photo by James Ulvog.
The scheduled production cuts from OPEC are nearing the expiration date as oil prices drop further. Why are they in such a difficult position? Photo above illustrates 12 specific things contributing to their discomfort.
Some articles describing their troubles and why the troubles won’t be going away anytime soon:
5/3/17 – Wall Street Journal – Oil Forecast to Fall Sharply if OPEC Doesn’t Extend Production Cuts– Article says the oil market has priced in an extension of the OPEC production cut. If correct, that means oil prices will fall if the production cut is not extended during meetings this month.
Article has a graph showing forecasts from 14 banks of their guesses on oil prices through the end of the year. For 4th quarter, the estimates range from mid-$40s to almost $70, with most of the estimates in the high $50s or very low $60s.
Article speculates that without an extension, price could drop into $40s.
5/5/17 – Bloomberg – OPEC Runs Out of Options as Bid to Boost Oil Price Fizzles – Article says the OPEC producers have kept to their agreed upon production cuts. That pushed prices up for a while but now prices are back to where they were when the cuts were announced.
…a group of like-minded producers, who act in concert—or collusion—to achieve a shared goal of increasing their profits by means of restricting supply, fixing prices, or destroying their competition by illegal means.
Article provides a history of OPEC’s efforts to control oil prices over the decades and then gives a recap of last few years.
OPEC tried to take out American shale drillers in 2014. Prices dropped further than they expected. Over 100 US producers went BK. US output dropped from 9.7M bopd to 8.9M bopd.
However, the drillers that survived developed more economical, more productive, and more effective techniques. Huge numbers of driller survived.
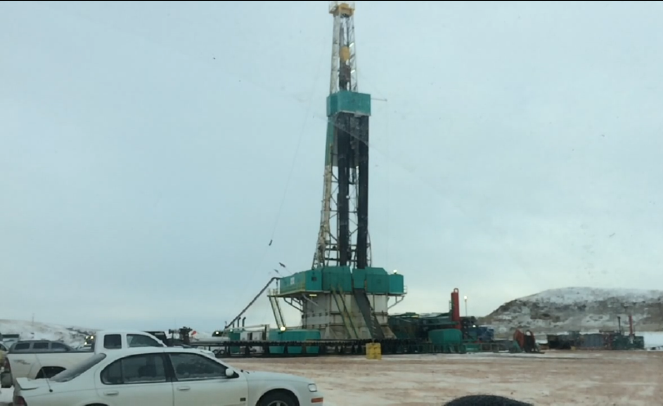
Training rig in Williston. September 2015 photo by James Ulvog.
I’ve been watching the tally of daily rig count for a while. When I think about it, I jot down the count listed at The Million Dollar Way blog. Occasionally, as in every few months, I post my tallies.
By the way, if you have even the slightest interest in my comments on my blog you really, really, reallyneed to read MDW.
Decided to put all that data into a graph to help me see the trends from another direction. So, I combined all the data that has been accumulated haphazardly over time and put it in a graph.
If it helps you see some patterns, I’ll share my graph.
Keep a few things in mind:
The data is accumulated when I think of jotting it down, so this is not a complete database
Don’t read anything in to the gaps in data
Data hasn’t been double-checked, so there are likely inaccuracies
This shows general trends
The efficiency of drilling and total output from a well has improved radically in the last few years so data is not comparable over long terms
Having undercut my data and graph, here is a picture of the rig count in the state:
Where you see one well today, eventually there will be 4 or 8 or 12. That concept and the above photo are yet more illustration of why Bakken, Eagle Ford, and Permian Basin, are strategic threats to OPEC. October 2013 photo by James Ulvog.
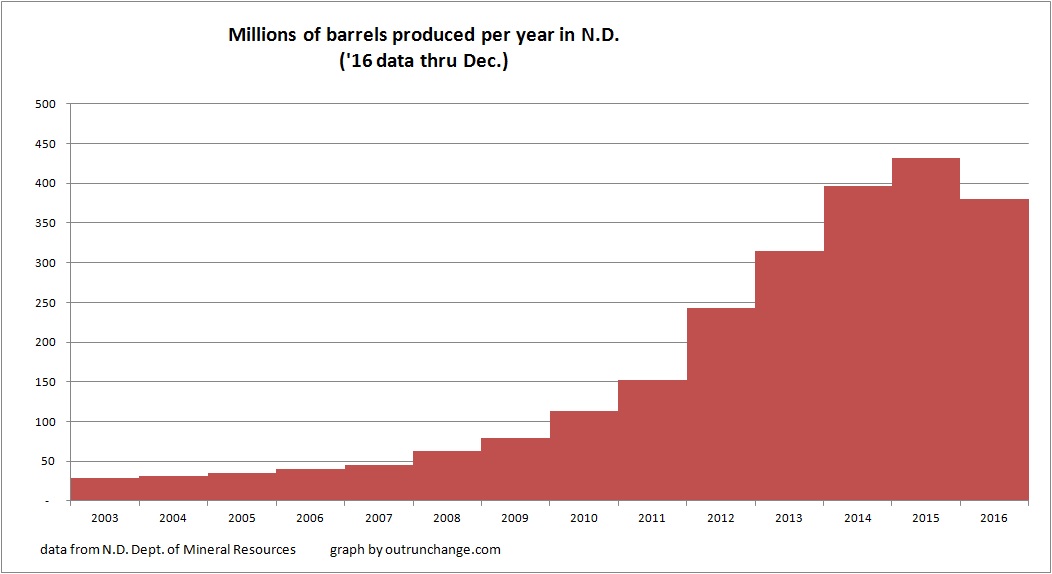
Let’s look at some longer term graphs of oil production in North Dakota and the value of that production. Here is a view of the annual oil production in the state:
The fascinating insight from that graph is production did not drop in 2015.