Well completions by year in North Dakota

Photo by James Ulvog.

While pulling together the graphs of oil production in North Dakota for 2018, I wondered what the trend of well completions might look like.

So, pulled a graph together. Primary source of my data is a spreadsheet I maintain of the monthly information released by the N.D. Department of Mineral Resources. Well completions is one of many data points accumulated on the spreadsheet.

Continue reading “Well completions by year in North Dakota”

In 2018, North Dakota oil production broke record level of output 6 times during 8 months.

Two things to notice. Lots of space between pumpjacks means there will eventually be several more wells on that pad. Lack of any storage tanks means the pad is tied directly to an underground pipeline. Photo by James Ulvog.

Oil production in North Dakota hit an all time high of an average of 1,229,572 barrels of oil per day (bopd) back in December 2014.  The effort by Saudi Arabia to flood the market in order to drive down prices in order to collapse the US shale industry slowed production in North Dakota but didn’t succeed in killing the shale sector.

Output fell to a low of 942,322 bopd in December 2017. Output then started rising with a typical slowdown in winter of 2017/2018.  After the winter lull production again climbed.

In 2018, producers in North Dakota broke the record level of production six times in the last eight months. The record-breaking months:

Continue reading “In 2018, North Dakota oil production broke record level of output 6 times during 8 months.”

North Dakota oil production hits another record in December 2018

Photo by James Ulvog.

Average production of crude oil in North Dakota rose 1.79% in December 2018, setting yet another record. The production in December was 1,401,385 bopd (preliminary).

At the end of 2017, production was 1,182,836 ave bopd (final). In one year, that is an increase of 218,549 bopd, or a whopping 18.5%.

Statewide and Bakken shale production has been trending up sharply.  The rapid rise since last winter’s lull is clear.


For a longer term perspective, check out the average daily production since 1990:

Continue reading “North Dakota oil production hits another record in December 2018”

Drilling and completion results in North Dakota through October 2018

Drilling rig used for training by Nabors Drilling. Photo by James Ulvog.

For some details on the production effort behind the rise in oil production in North Dakota, check out the number of rigs in operation and some indications of the results.

Number of rigs has been trending up since late 2016. This is response to increasing oil prices. The rig count dropped dramatically in 2015, which was OPEC’s goal in dropping prices. The drastic increases in efficiency of drilling mean the count of rigs in 2012 through 2014 is not comparable to the current count. Probably should be in two different graphs.


With the recent drop in prices, a larger number of the drilled wells are not immediately completed. Instead they are put in the fracklog category, essentially placed on the shelf as inventory awaiting completion until prices rise.

Continue reading “Drilling and completion results in North Dakota through October 2018”

Estimated value of oil production in North Dakota through October 2018

Photo by James Ulvog.

Production of oil in North Dakota has been shooting up. Prices have dropped recently. What does that look like in terms of the value of oil produced?

Multiplying the monthly production by the average sweet prices in the state results in the following estimated value of monthly production in the state:


There is a discount in sweet crude prices in the state compared to West Texas Intermediate due to transportation cost.  The prices realized in North Dakota are:

Continue reading “Estimated value of oil production in North Dakota through October 2018”

North Dakota oil production hits another record in September 2018 and again in October

Photo by James Ulvog.

Average production rose 5.2% in September 2018, hitting a new record, then rose another 2.4% in October for another record level. The production in October was just under 1.4 million bopd.

At the end of 2017, production was 1,182,836 ave bopd. In September average was 1,359,284 (final) and October was 1,391,877 (prelim).

Some production graphs – – –

Statewide and Bakken shale production has been trending up sharply.  Last winter’s lull is quite visible. The output curve is starting to take on the rapid growth angle visible back in 2012 and 2013.


For a longer term perspective, check out the average daily production since 1990:

Continue reading “North Dakota oil production hits another record in September 2018 and again in October”

The work effort driving the record levels of oil production in North Dakota.

Previous post showed a graph of the new records of oil production in North Dakota in recent months.

Let’s look at the drilling and completion work driving the rising levels of production.

Keep in mind that the drastic improvements in productivity has decoupled the number of drilling rigs from the number of wells drilled.

Also keep in mind the ‘fracklog’, or the number of wells in the backlog of wells that have been drilled but not yet completed. In essence, wells are drilled and then left in inventory. When the expectations of prices are right and there are completion crews available, production companies can quickly complete a well and get it into production.

The number of drilling rigs in the field dropped dramatically during 2015. Since the fall of 2016, the count has slowly risen, with a noticeable pickup in the last five months:


The number of wells awaiting completion, the ‘fracklog’, has been increasing slightly over the last year but dropped over the last two months:

Continue reading “The work effort driving the record levels of oil production in North Dakota.”

Oil production in August 2018 for North Dakota hits another record level

In August the crude oil production in the state hit an average of 1,291,496 barrels of oil per day (bopd). As always, that is the preliminary tally, which will change when a few late reports arrive.

The record high before a several year slump was an average 1,229,572 bopd in December 2014.

In the last five months there have been three record highs with two months barely under the 12/14 record.

Here is my graph of production state-wide and Bakken only (including Sanish, Three Forks, and Bakken/Three Forks levels). Notice the steady increase over the last few months and a strong rise since winter of ‘16/’17.


For a far longer perspective, look at the average production data since 1990.  I like this graph because it shows a pattern of explosive growth from about 2008 through late-2014, a drop until around the end of 2017 and a rapid growth since then. The longer view:

Continue reading “Oil production in August 2018 for North Dakota hits another record level”

Oil production in May 2018 for North Dakota hits new record level

Multiple pumpjacks on a well pad is a normal thing in North Dakota. Photo by James Ulvog.

In May the crude oil production in the state hit an average of 1,244,629 barrels of oil per day (bopd). As always, that is the preliminary tally, which will change a bit over the next two months as a few late reports arrive.

That is 15,057 bopd higher than the previous record of 1,229,572 bopd in December 2014.

Here is my graph of production state-wide and Bakken only (including Sanish, Three Forks, and Bakken/Three Forks levels):

For a longer term perspective, here is the total monthly production since 1990:

Continue reading “Oil production in May 2018 for North Dakota hits new record level”

Value of monthly oil production in North Dakota through April 2018

Fourteen wells are on that pad, which is on the south side of Williston near the Missouri River. Photo by James Ulvog.

Previously discussed the near-record level of oil production in the state during April. Here is the graph of average daily production since 2004:

What is the value of that oil? Multiply those average daily production levels by days in the month and then multiply by the following average sweet crude prices in the state:

Continue reading “Value of monthly oil production in North Dakota through April 2018”

Oil production for April 2018 in North Dakota getting close to record level

There is space for more than 6 pumps on that site. Might be as many as a dozen when fully drilled. Photo by James Ulvog.

In April crude oil production in the state hit an average of 1,224,948 barrels of oil per day (bopd). That is the preliminary tally, which will change a bit in the next report as a few late reports arrive.

That is really close to the record high of an average 1,229,572 bopd in December 2014. Another 4,624 per day would get the state to a new record. That could be achieved for April by late reports from the field. Or, since production increased 42,112 bopd since December, the May data will likely break the record.

Here is my graph of production state-wide and Bakken only (including Sanish, Three Forks, and Bakken/Three Forks levels):

For more background, here is the total monthly production since 2004:

Continue reading “Oil production for April 2018 in North Dakota getting close to record level”

Volume and value of 2017 oil production in North Dakota

Notice all the empty space on that pad? Notice the disproportionately high number of storage tanks for the number of pumpjacks on site? One day there will be a lot more wells in operation. Photo by James Ulvog.

Before showing the average daily production, annual production, and value of that production, just a note on December 2017 production.

Average daily production dropped from 1,196,976 bopd (revised) in November to 1,181,319 bopd (preliminary) in December, a decline of 15,657 bopd, or 1.31%.

Here is what the average daily production by year looks like. Notice the recovery in 2017?

Continue reading “Volume and value of 2017 oil production in North Dakota”

Oil production in North Dakota increases 1.0% in November 2017; getting close to record output

Production of crude oil increased 12,110 bopd in November, or 1.02%, going from 1,182,810 (revised October) to 1,194,920 (preliminary November).

The record high production was 1,227,529 average bopd in December 2014. Production in November 2017 is 32,609 bopd below the high in December 2014. It will only take another 2.7% increase in average production to clear the previous record. I’ll guess that will happen in December 2017 or January 2018, before the winter start to cut into production. (That is not a very bold prediction since Mr. Helms thinks the record production level will easily be surpassed regularly in later 2018.)

Above is a graph of average production in the state since 2004.

Check out the following graph for production from only Bakken formations and total for the state since 2008:

Continue reading “Oil production in North Dakota increases 1.0% in November 2017; getting close to record output”

Crude production during October 2017 in North Dakota rises 7%, to 1.18 million barrels a day

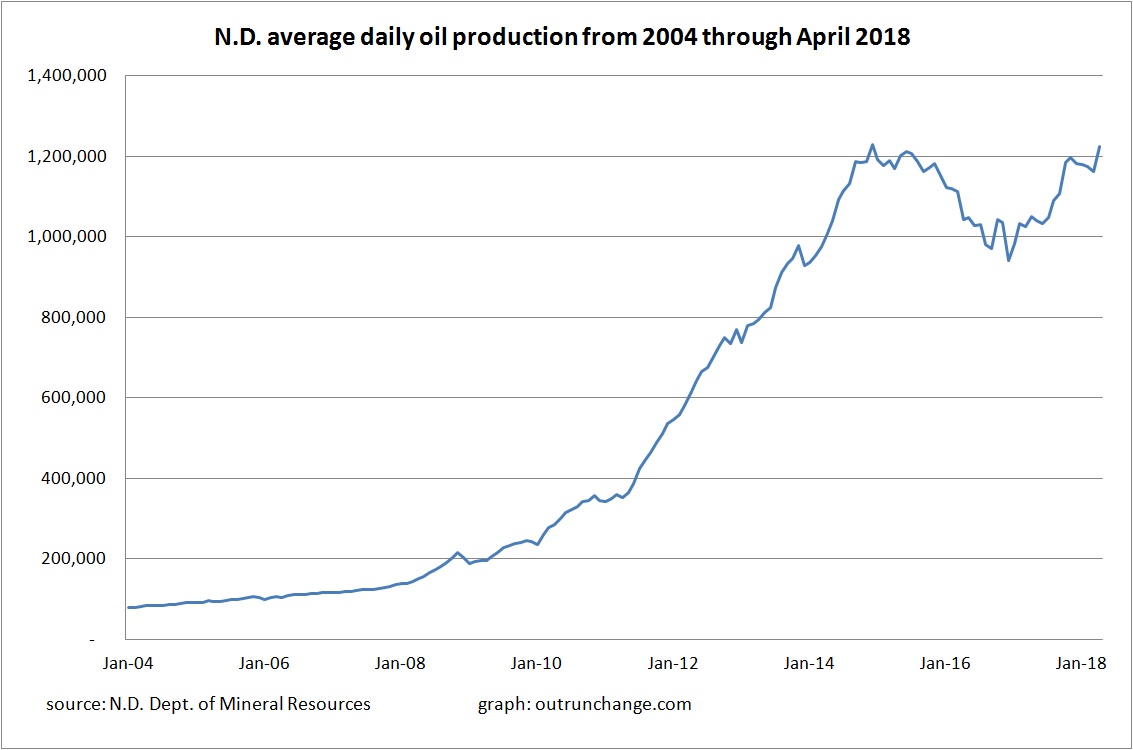
The big increase of 78,154 bopd to 1,185,499 bopd follows 4 months of over 1.5% increase each month. That is a 14.8% runup in fourth months.

The record high production was 1,211,330 bopd in June 2015. There have only been four months when the average daily production was higher than in October 2017.

Another 27K bopd increase would put the state at a new record for production. With November and December production stats to go before the weather turns really nasty, that level of increase is likely. (Notice how lame that prediction is? A forecast two months out that is a mere 2% increase, when 8 of the 13 months have seen greater than 1.5% increase and 5 months saw a decline.) For perspective, at mid-December the couple of snow falls received so far haven’t outlasted the sunshine.

In my next post I will scratch my head wondering why the production jumped so much in one month.

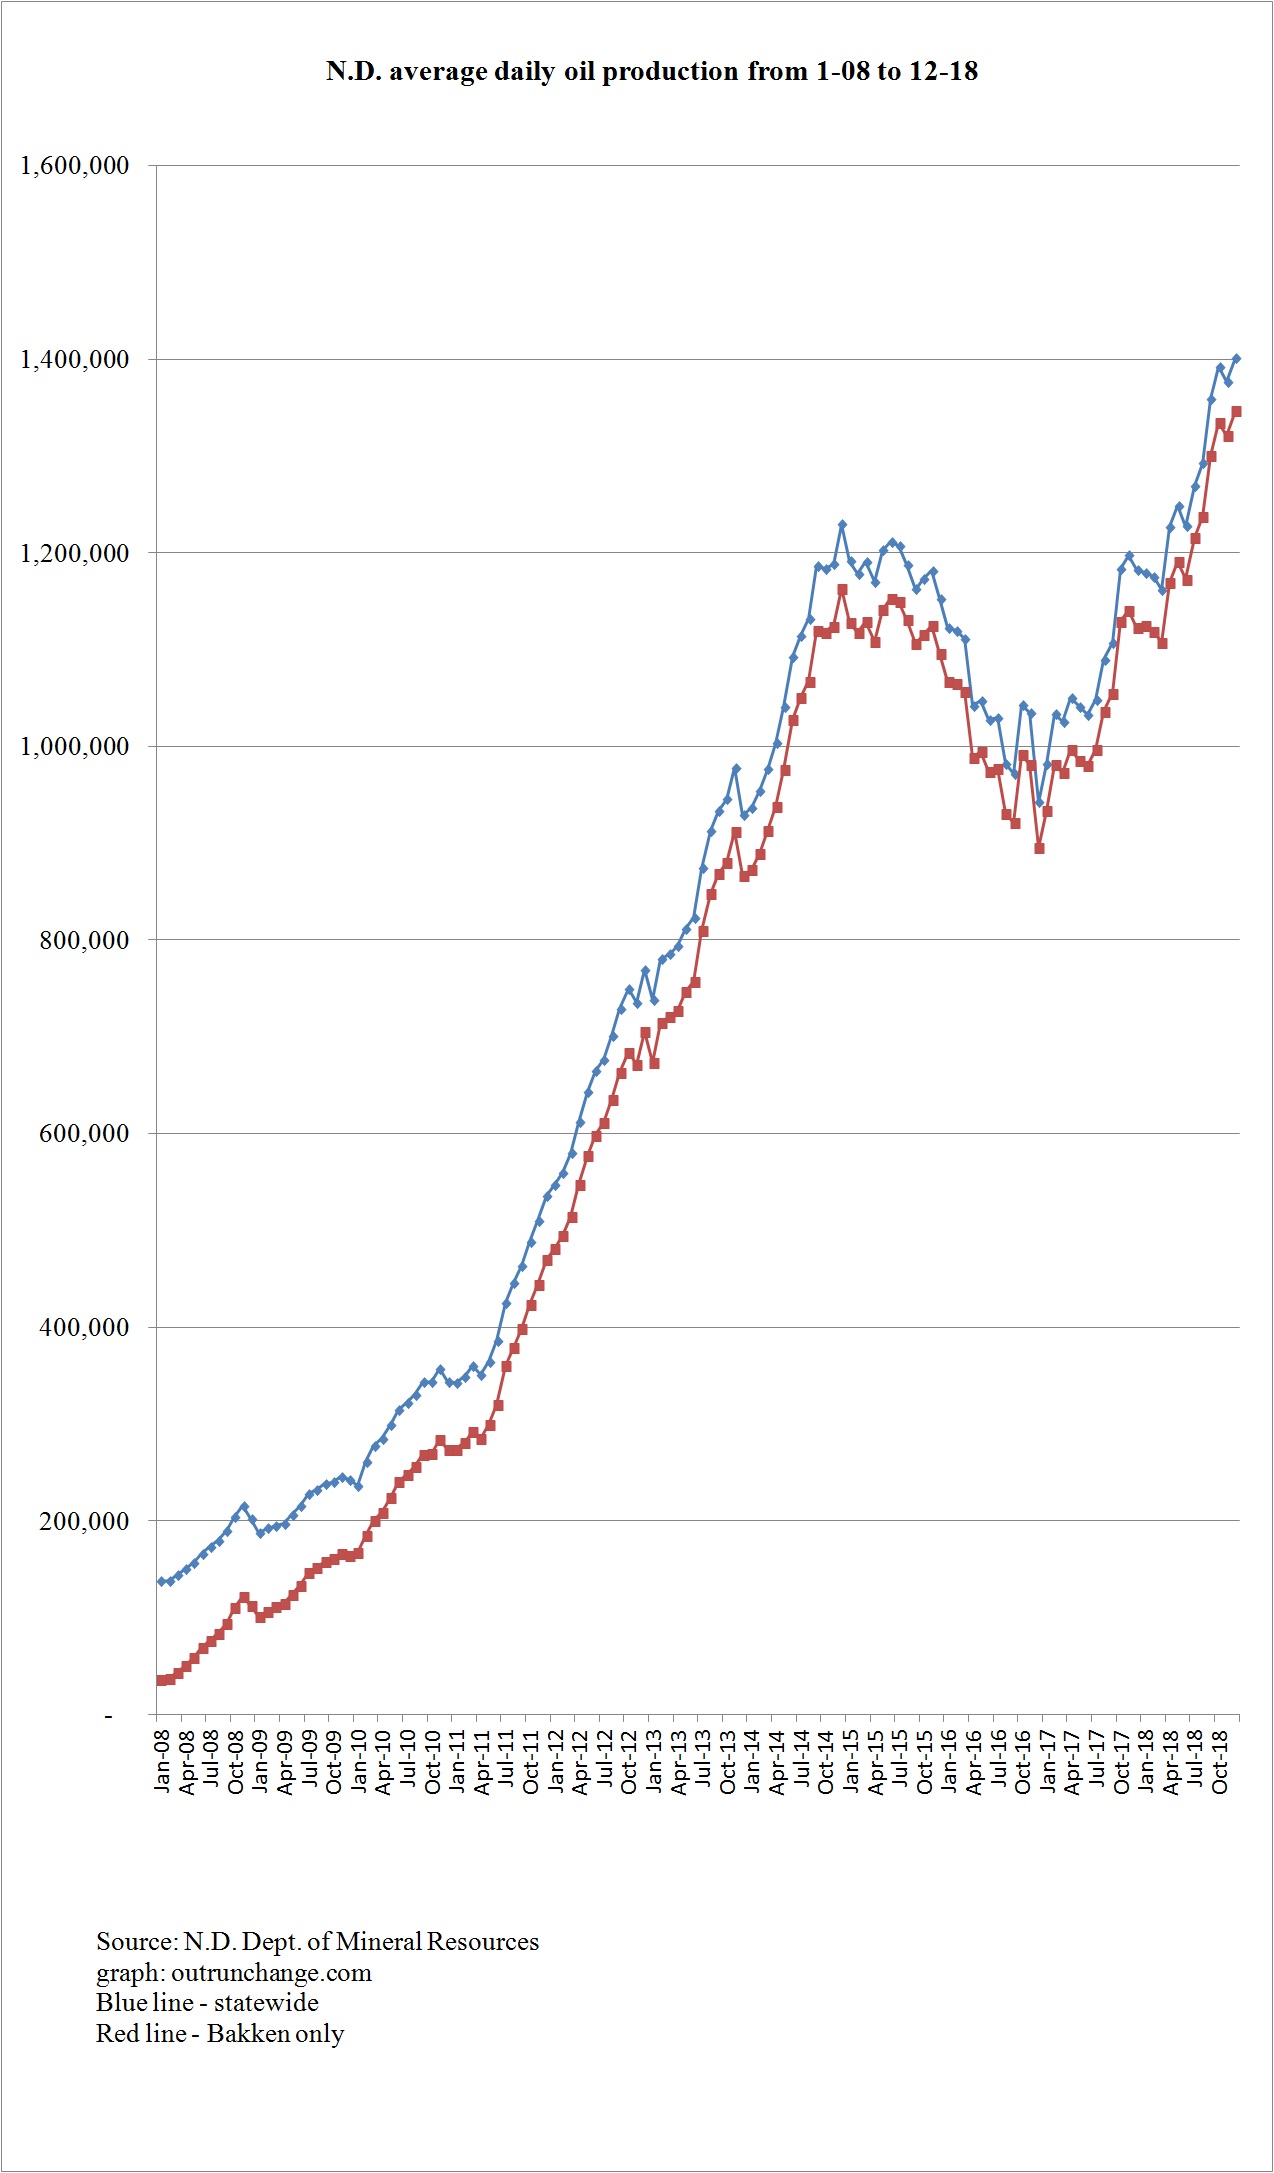
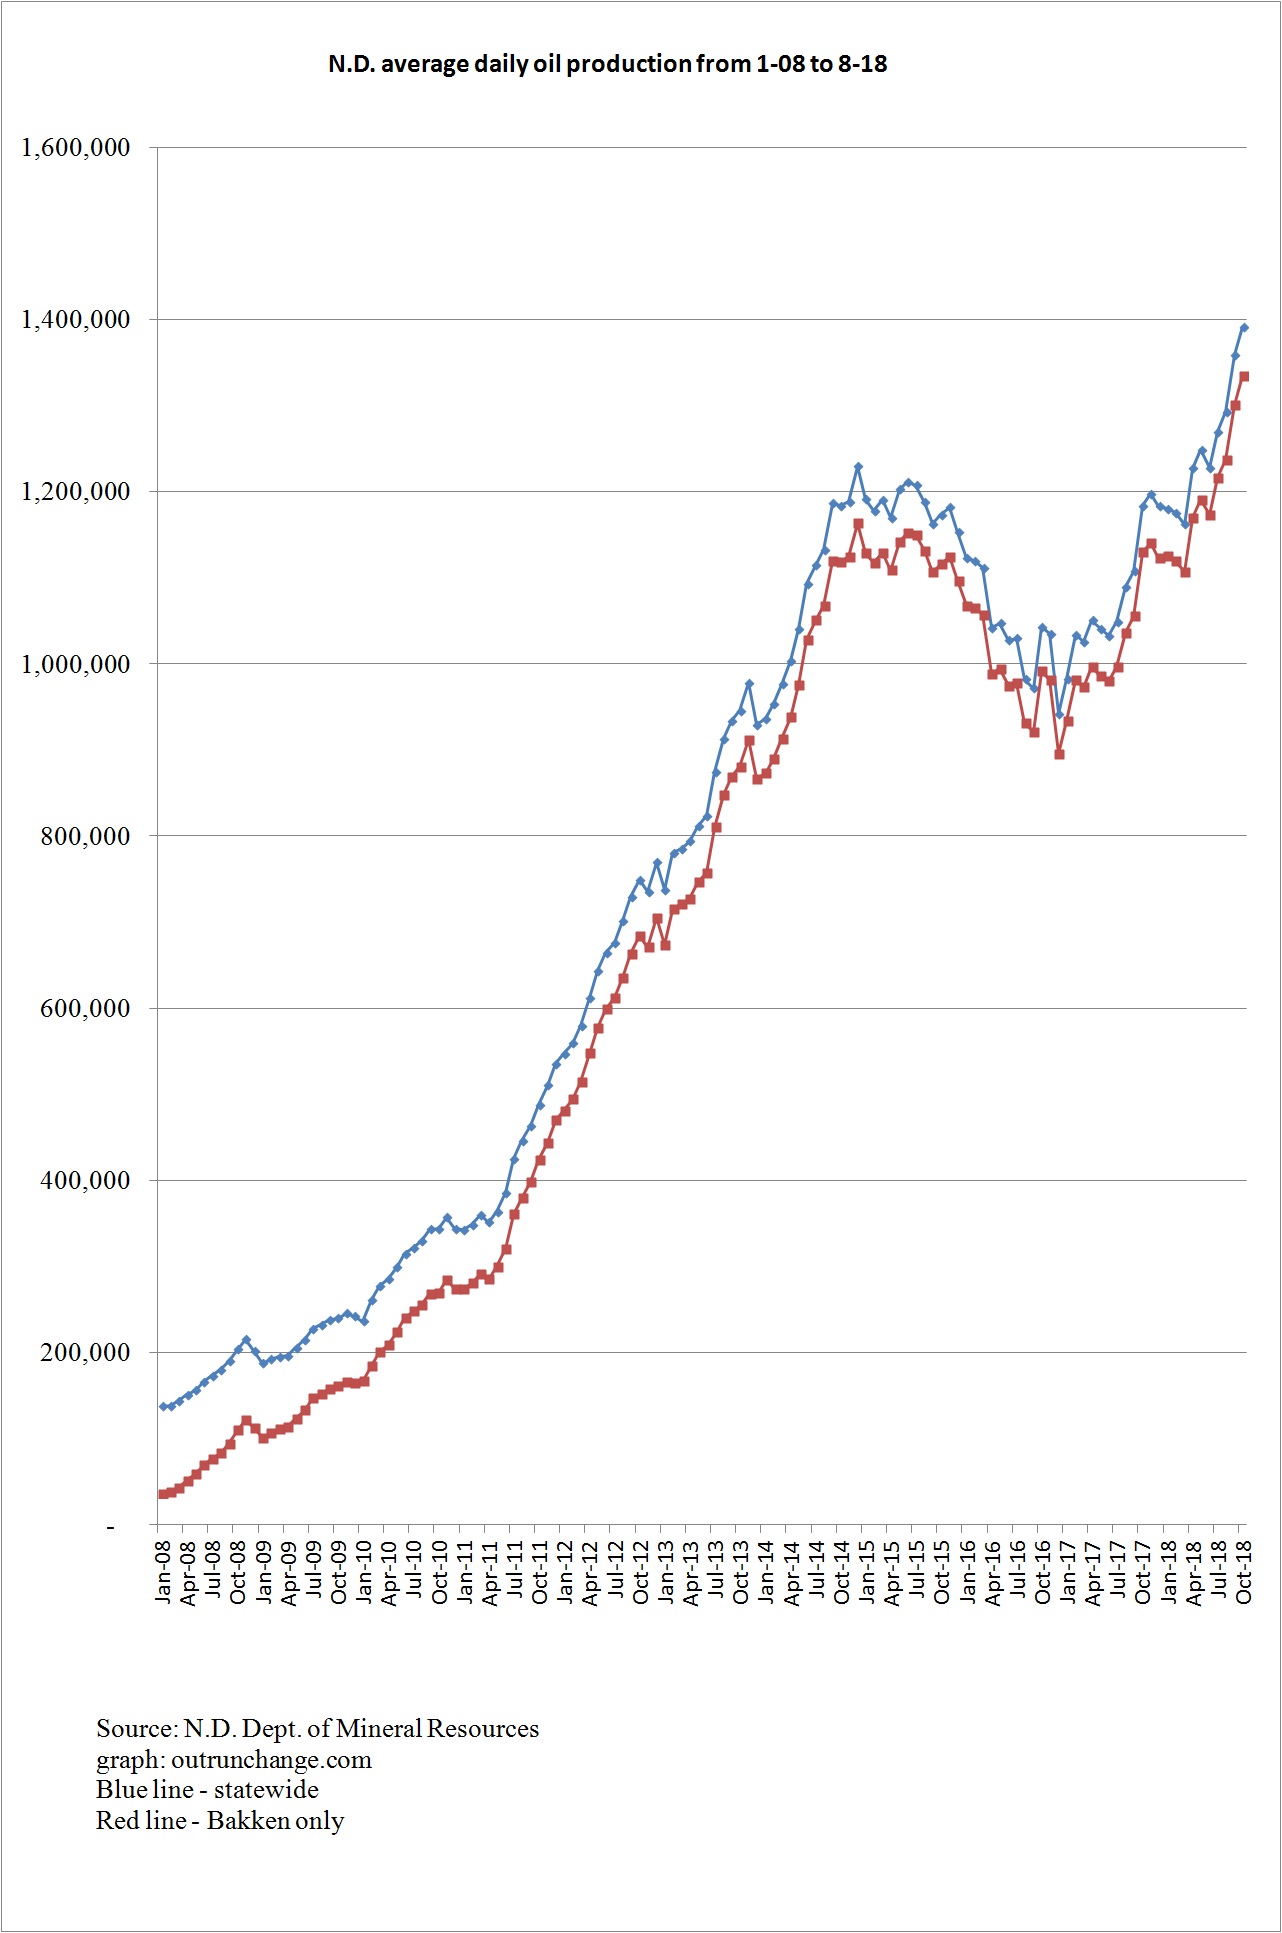
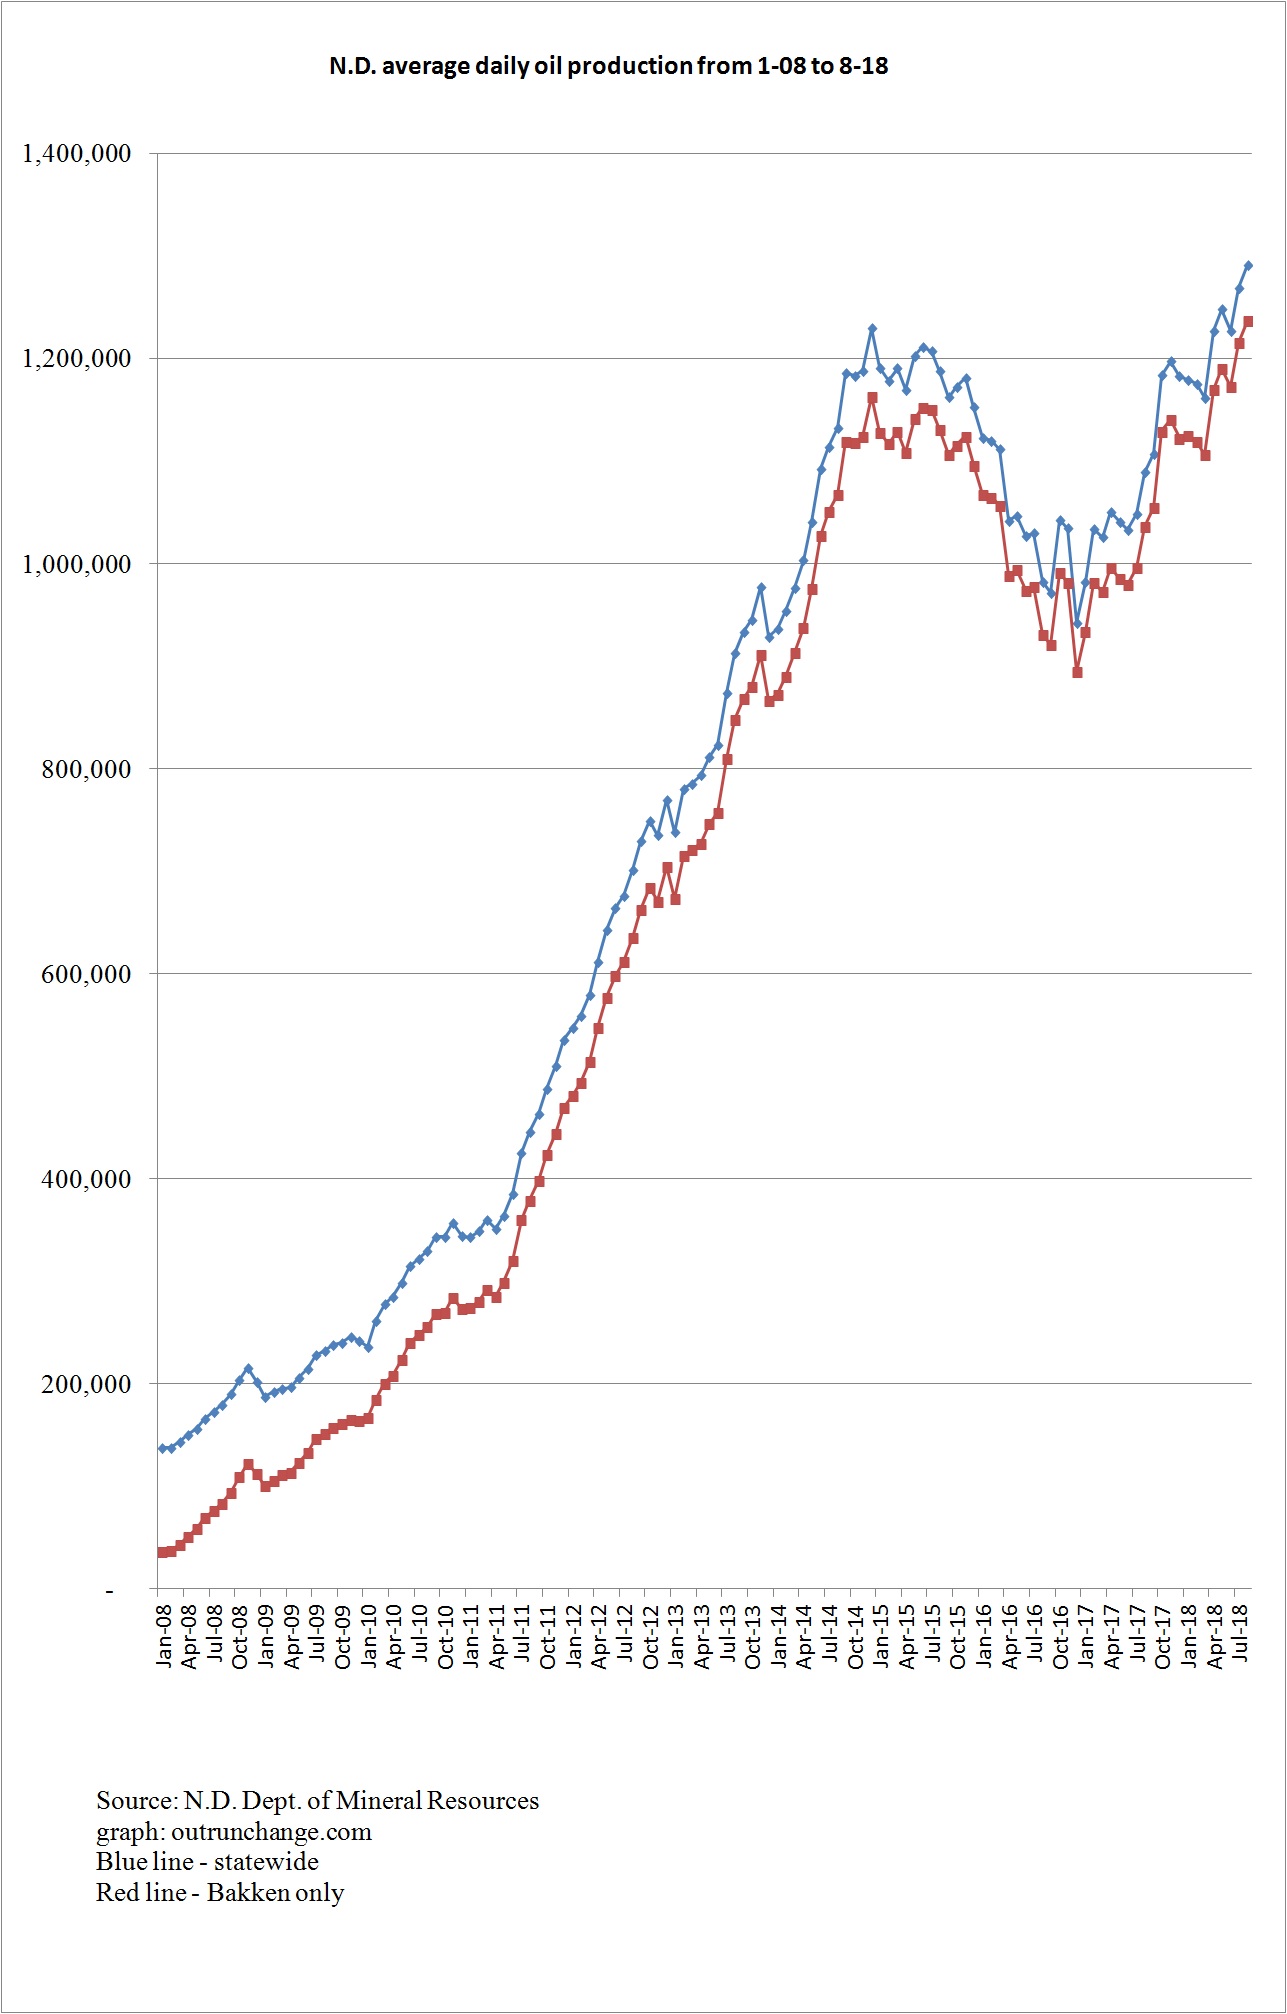
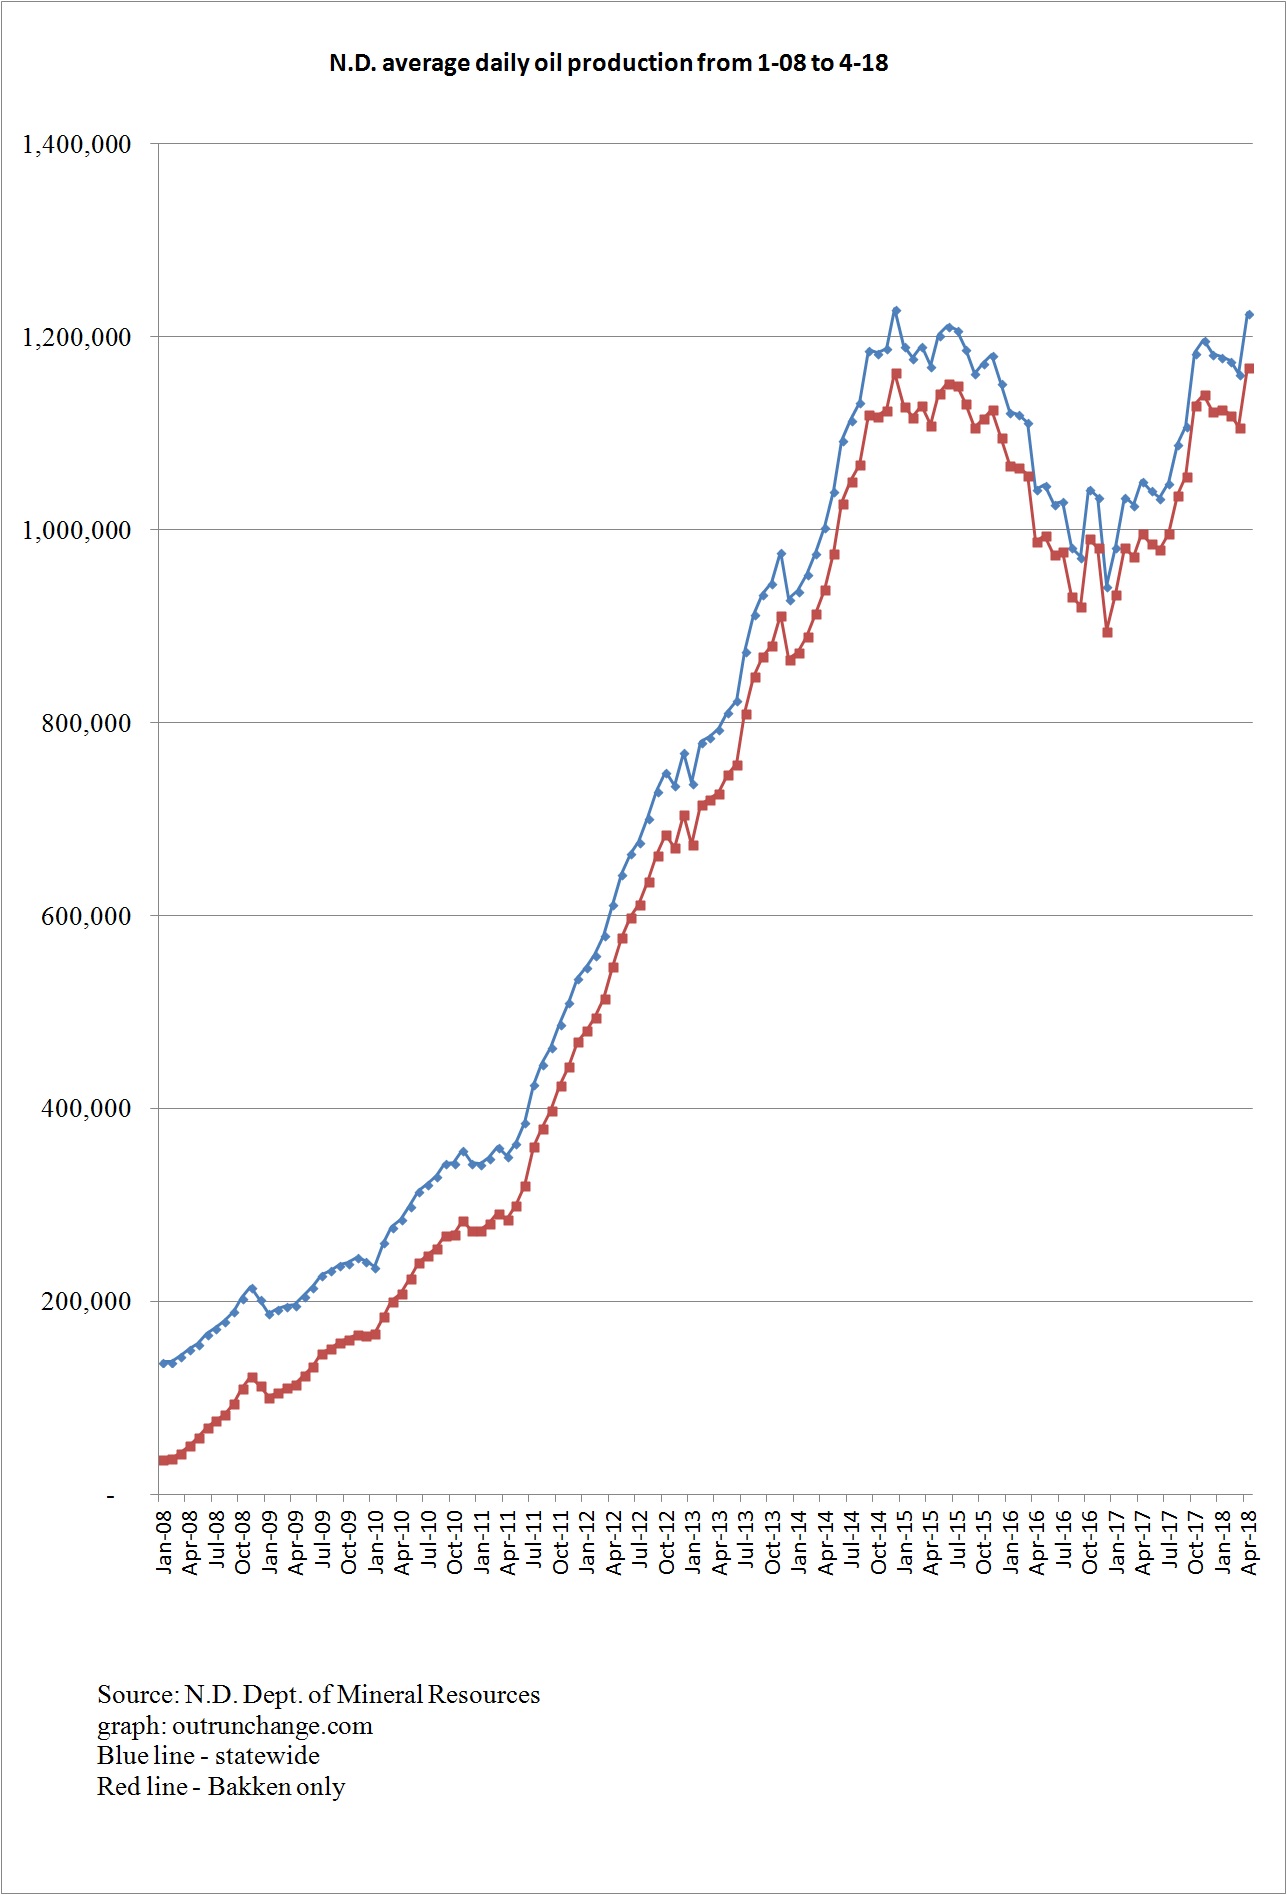
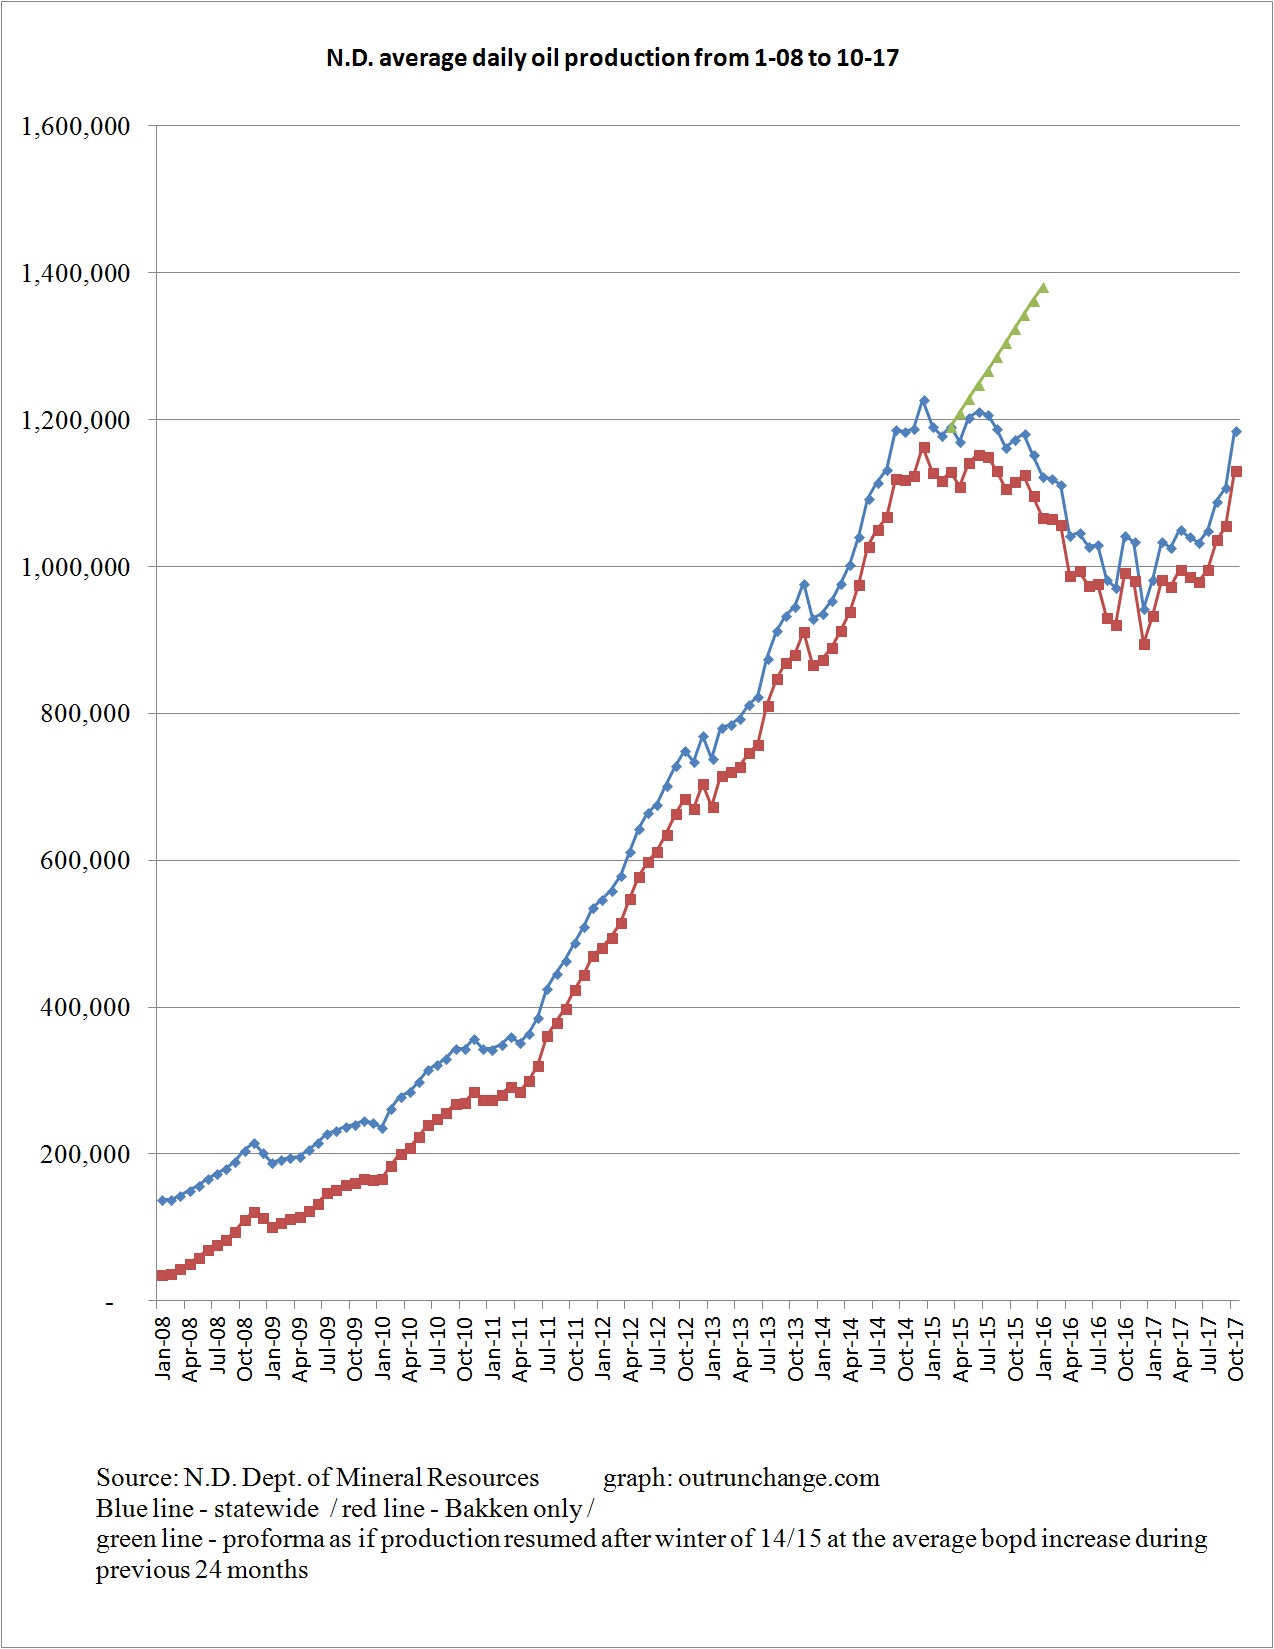
Here is the monthly production, with a breakout of oil from the Bakken formation (which also includes the Sanish, Three Forks, and Bakken/Three Forks Pools formations):


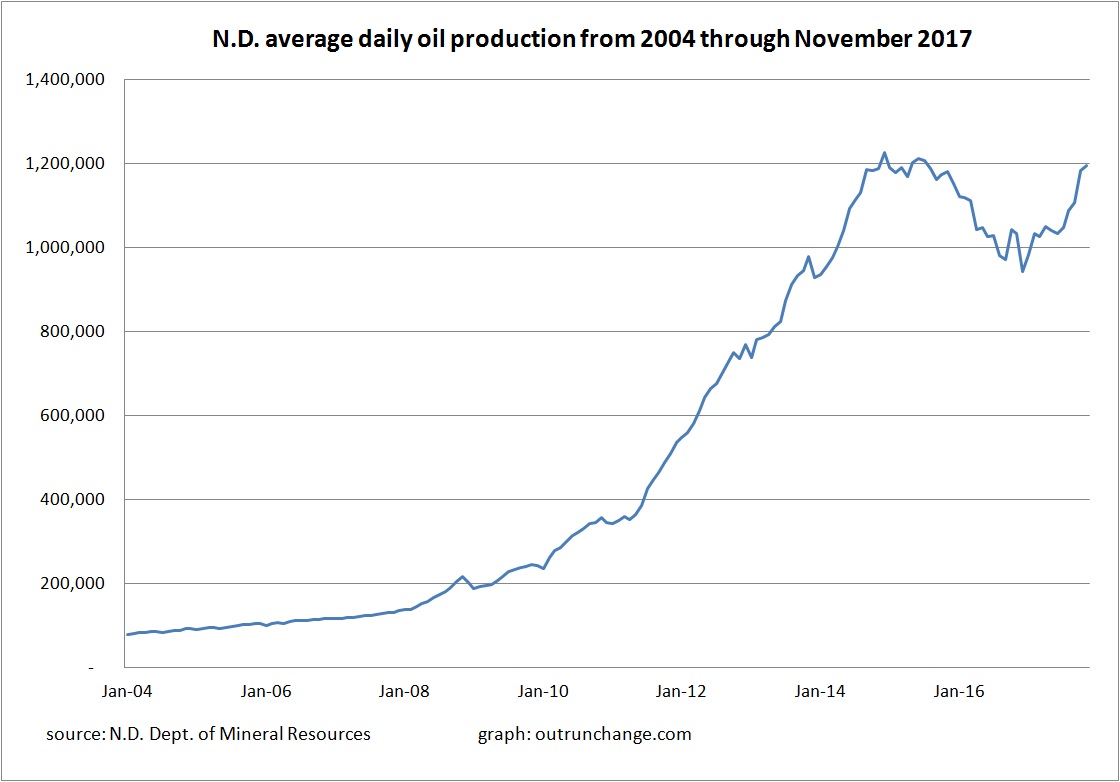
For a longer term perspective, here is the total production in the state since 1990:

Continue reading “Crude production during October 2017 in North Dakota rises 7%, to 1.18 million barrels a day”

Additional graphs of North Dakota oil production in August 2017

Notice the large size of the nearest pad in relation to the wells in place and the number of storage tanks. There will be many more wells on that pad when it is finished. Photo by James Ulvog.

Here are more views of crude oil production in August. Previous post mentions the output hit 1.087M bopd in the month.

The 10/10/17 Director’s Cut says the DMR thinks the daily count of drilling rigs will drop if WTI goes below $45 for over 30 days. If WTI is above $55 for over 90 days, the rig count will increase.

That suggests price stability in the range of $45 to $55 will keep the rig count around the current level of 57.

The rig count has been in the high 50s for the last few months. It seems to have stabilized since spring 2017 and is up substantially from the low. Remember that the rig count today does not compare to the rig count a few years ago because drilling rigs today are far more productive than just two years ago.

Here is the view of monthly rig count:

What is the value of the crude produced at the average sweet price in the state? Check it out:

Continue reading “Additional graphs of North Dakota oil production in August 2017”