Oil production for April 2018 in North Dakota getting close to record level

There is space for more than 6 pumps on that site. Might be as many as a dozen when fully drilled. Photo by James Ulvog.

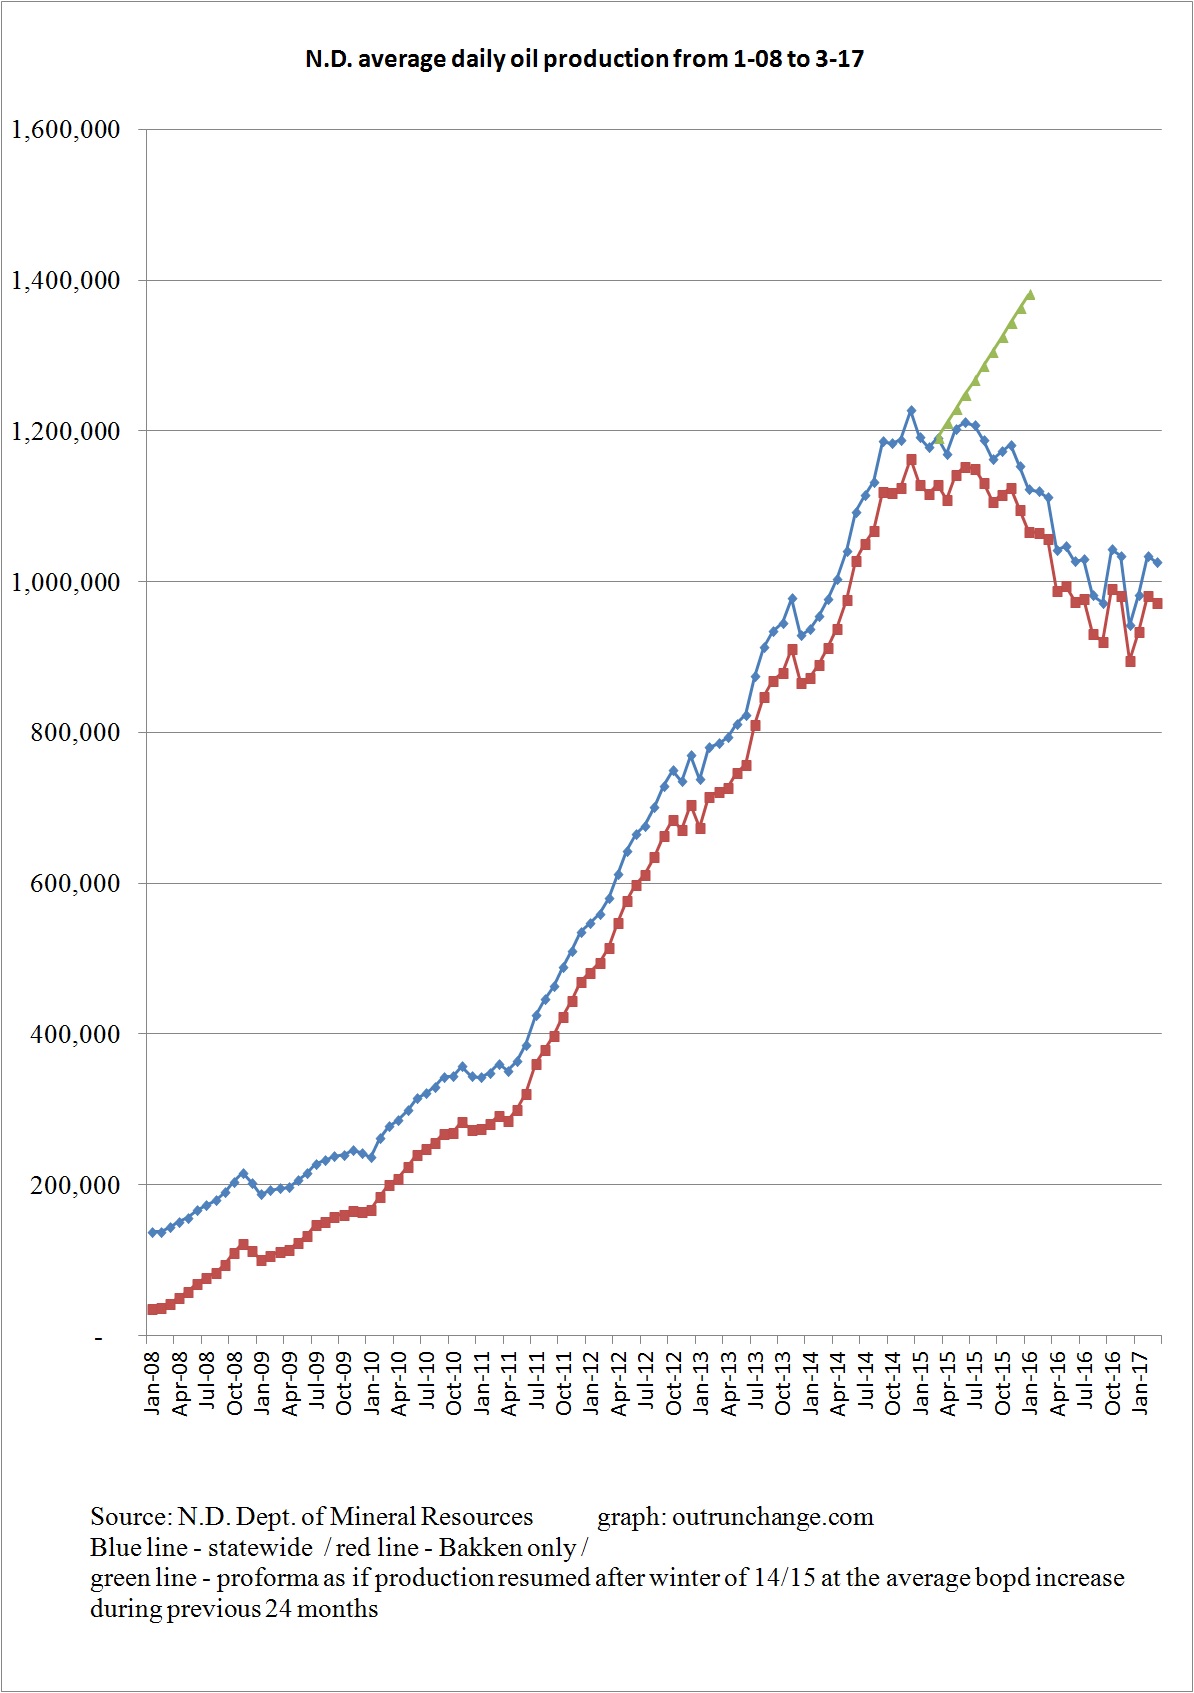
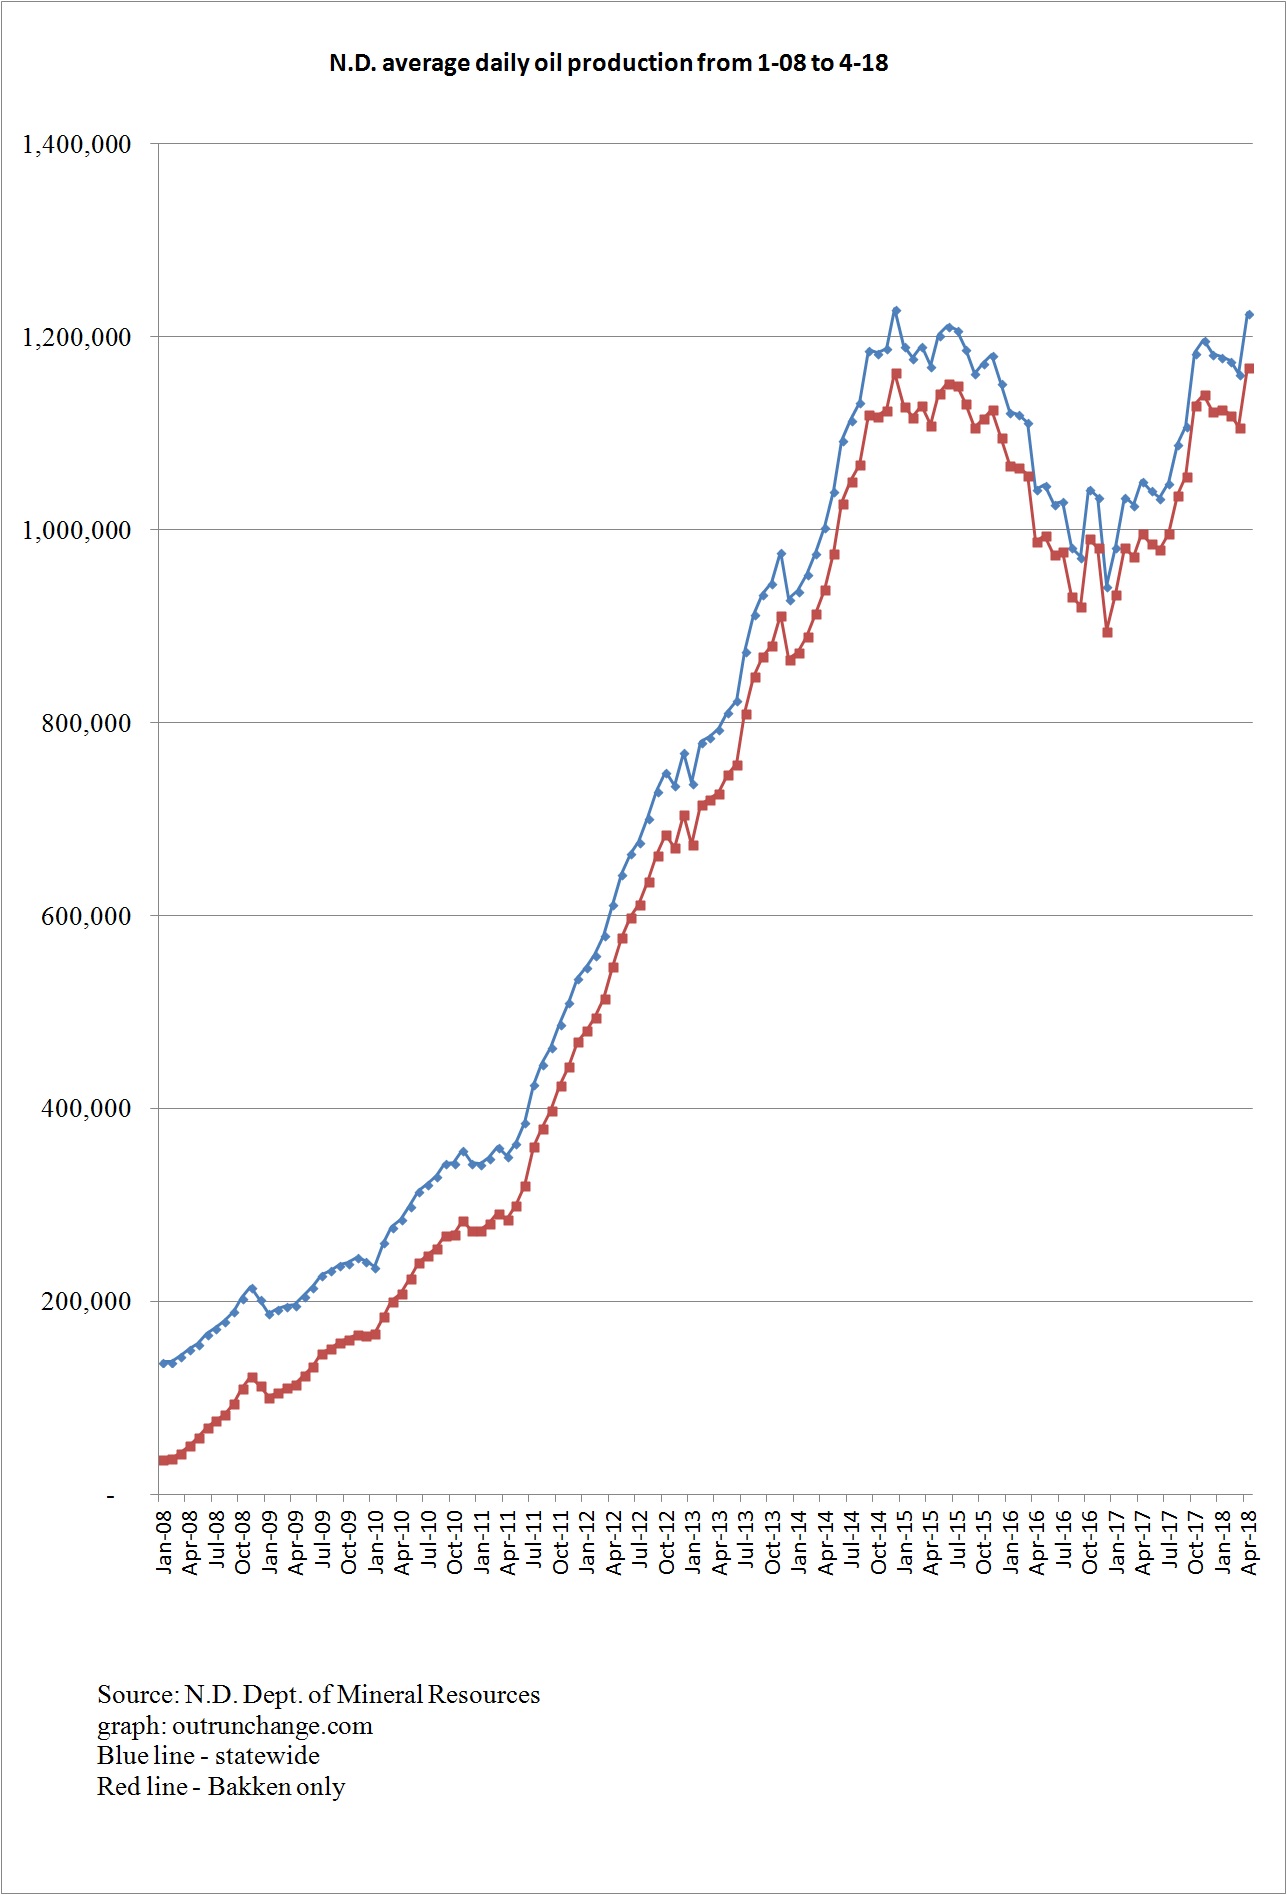
In April crude oil production in the state hit an average of 1,224,948 barrels of oil per day (bopd). That is the preliminary tally, which will change a bit in the next report as a few late reports arrive.

That is really close to the record high of an average 1,229,572 bopd in December 2014. Another 4,624 per day would get the state to a new record. That could be achieved for April by late reports from the field. Or, since production increased 42,112 bopd since December, the May data will likely break the record.

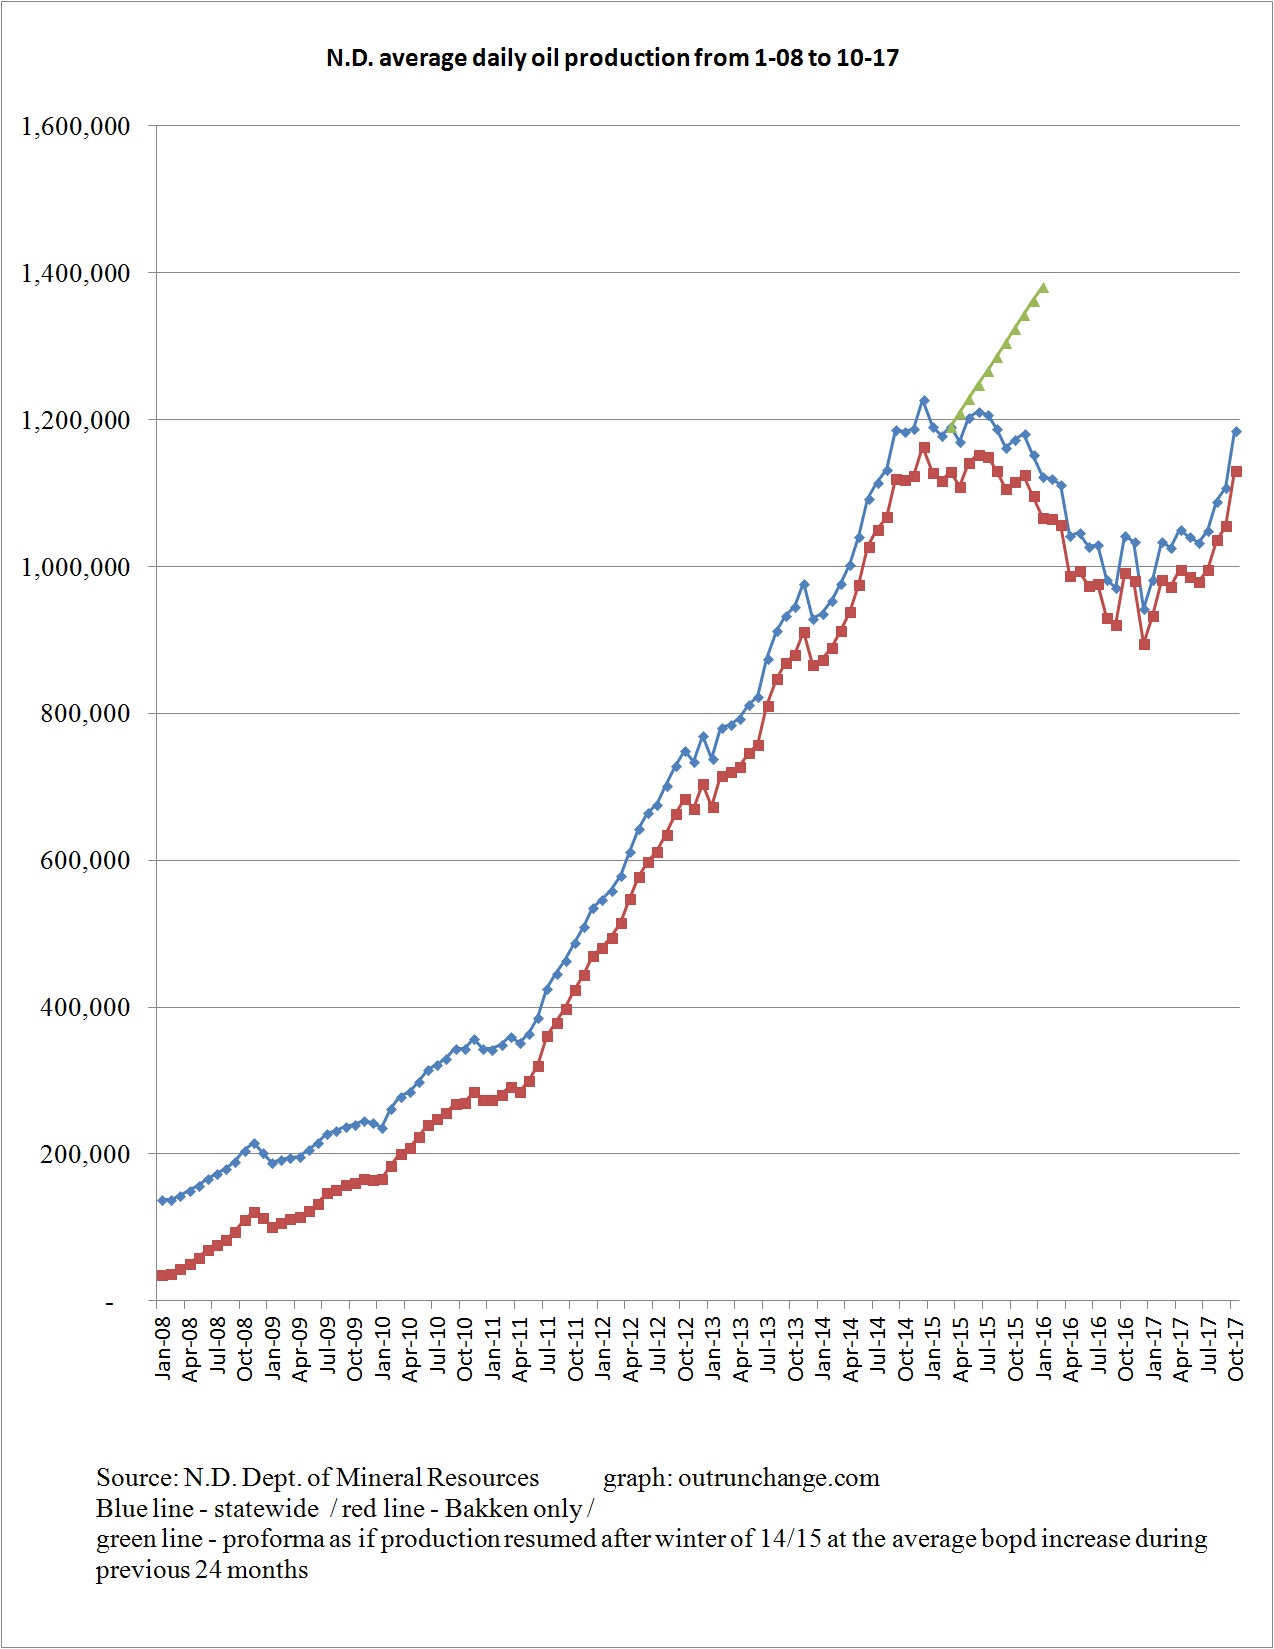
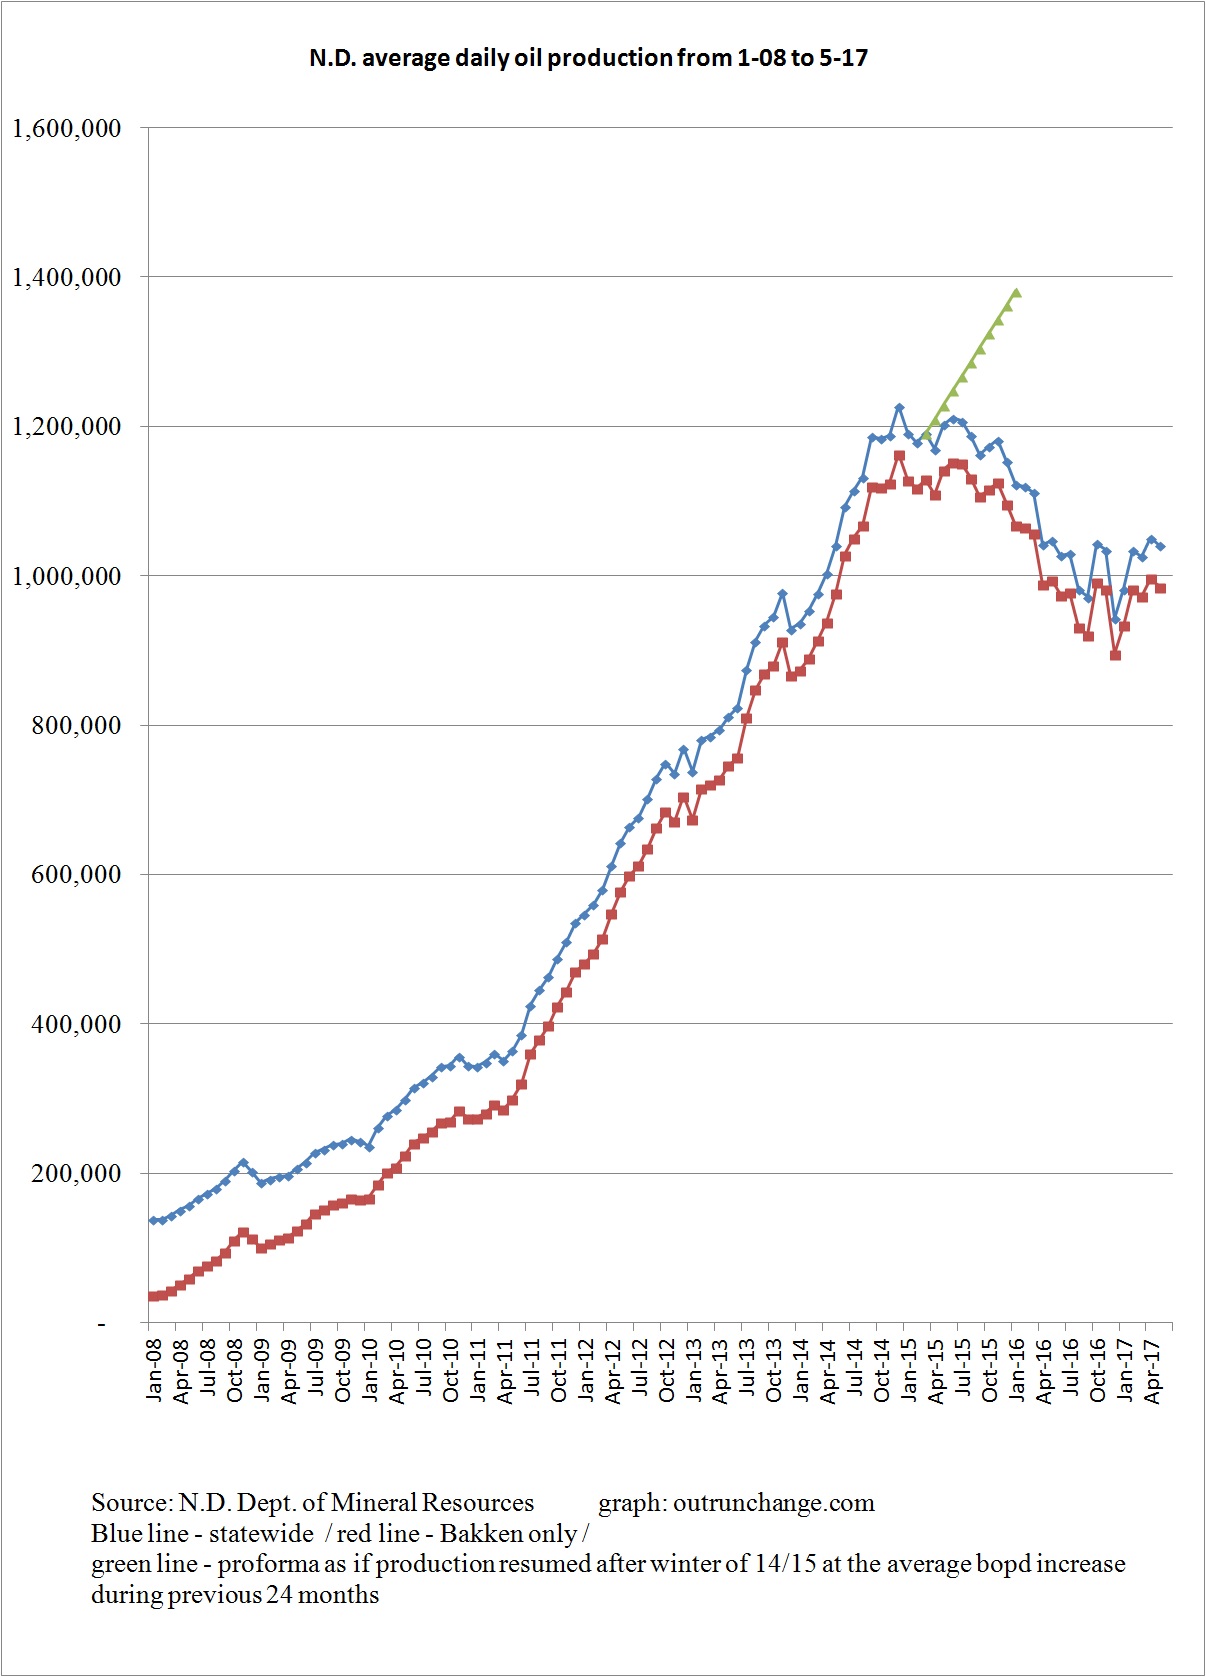
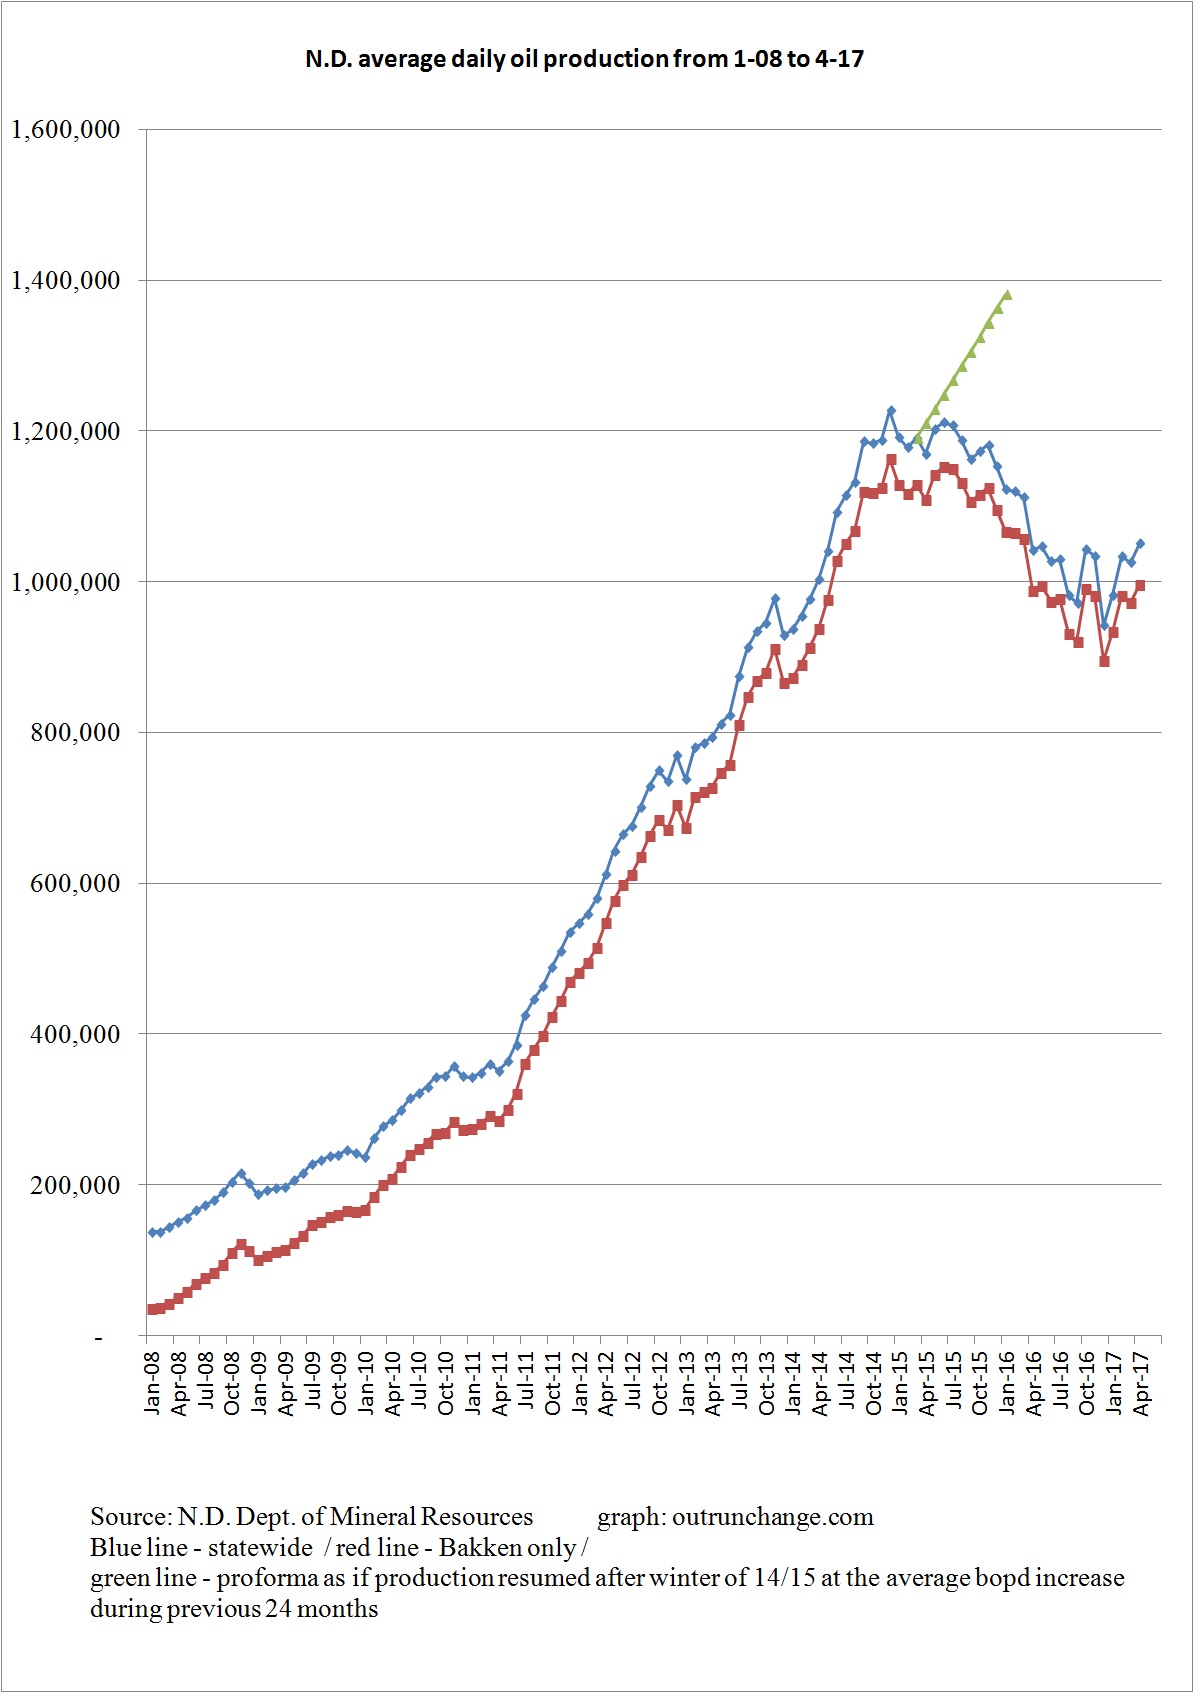
Here is my graph of production state-wide and Bakken only (including Sanish, Three Forks, and Bakken/Three Forks levels):

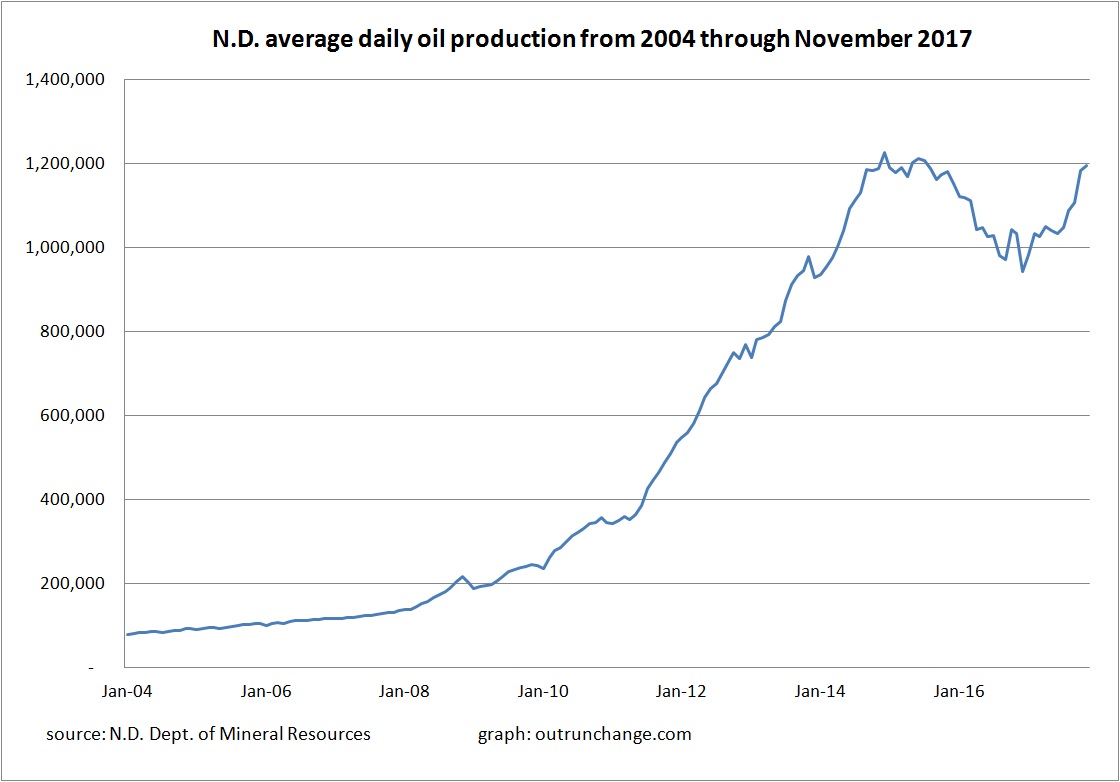
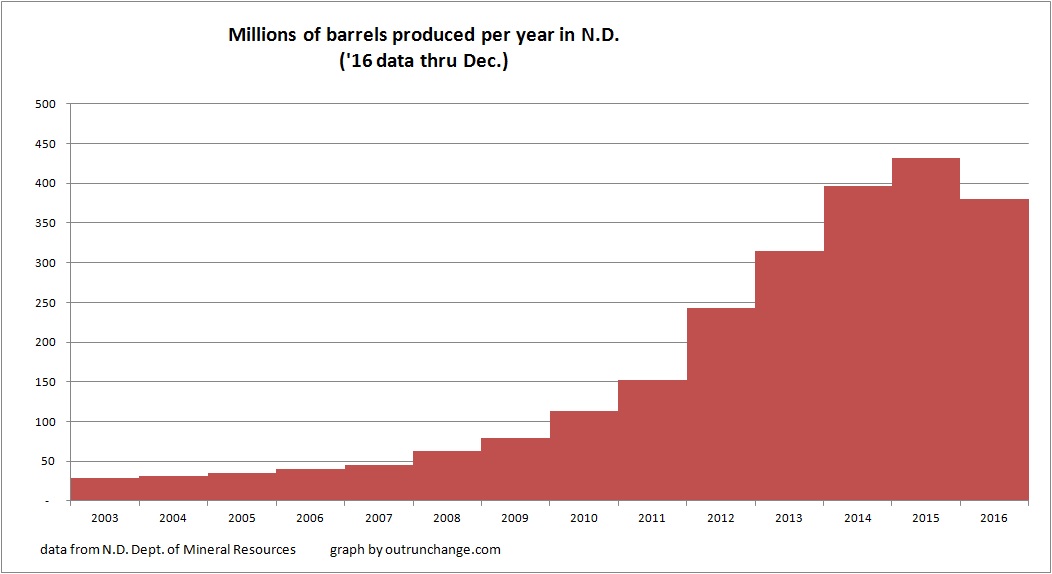
For more background, here is the total monthly production since 2004:

Continue reading “Oil production for April 2018 in North Dakota getting close to record level”

Volume and value of 2017 oil production in North Dakota

Notice all the empty space on that pad? Notice the disproportionately high number of storage tanks for the number of pumpjacks on site? One day there will be a lot more wells in operation. Photo by James Ulvog.

Before showing the average daily production, annual production, and value of that production, just a note on December 2017 production.

Average daily production dropped from 1,196,976 bopd (revised) in November to 1,181,319 bopd (preliminary) in December, a decline of 15,657 bopd, or 1.31%.

Here is what the average daily production by year looks like. Notice the recovery in 2017?

Continue reading “Volume and value of 2017 oil production in North Dakota”

Oil production in North Dakota increases 1.0% in November 2017; getting close to record output

Production of crude oil increased 12,110 bopd in November, or 1.02%, going from 1,182,810 (revised October) to 1,194,920 (preliminary November).

The record high production was 1,227,529 average bopd in December 2014. Production in November 2017 is 32,609 bopd below the high in December 2014. It will only take another 2.7% increase in average production to clear the previous record. I’ll guess that will happen in December 2017 or January 2018, before the winter start to cut into production. (That is not a very bold prediction since Mr. Helms thinks the record production level will easily be surpassed regularly in later 2018.)

Above is a graph of average production in the state since 2004.

Check out the following graph for production from only Bakken formations and total for the state since 2008:

Continue reading “Oil production in North Dakota increases 1.0% in November 2017; getting close to record output”

Crude production during October 2017 in North Dakota rises 7%, to 1.18 million barrels a day

The big increase of 78,154 bopd to 1,185,499 bopd follows 4 months of over 1.5% increase each month. That is a 14.8% runup in fourth months.

The record high production was 1,211,330 bopd in June 2015. There have only been four months when the average daily production was higher than in October 2017.

Another 27K bopd increase would put the state at a new record for production. With November and December production stats to go before the weather turns really nasty, that level of increase is likely. (Notice how lame that prediction is? A forecast two months out that is a mere 2% increase, when 8 of the 13 months have seen greater than 1.5% increase and 5 months saw a decline.) For perspective, at mid-December the couple of snow falls received so far haven’t outlasted the sunshine.

In my next post I will scratch my head wondering why the production jumped so much in one month.

Here is the monthly production, with a breakout of oil from the Bakken formation (which also includes the Sanish, Three Forks, and Bakken/Three Forks Pools formations):


For a longer term perspective, here is the total production in the state since 1990:

Continue reading “Crude production during October 2017 in North Dakota rises 7%, to 1.18 million barrels a day”

Average daily oil production in North Dakota down 0.98% in May 2017

Oil production in the state dropped about 1% in May, falling from average of 1,050,476 bopd in April (final) to 1,040,131 bopd in May (preliminary) That is a drop of 10,345 bopd for the month.

Million Dollar Way highlights the NDIC says a shortage of experience workers is slowing down completions.

Article also points out it will take another month to see what impact DAPL will having on the amount of oil shipped by rail. This is a big deal on the revenue realized by producers.

The spread between West Texas Intermediate and what Bakken producers get is about $11 a barrel. That is the cost of transport. The spread is expected to be $6 or $7 for oil shipped through DAPL.

Here are a few graphs to tell the production story:

Average production for state and Bakken only:

Value of monthly production, which seems to have stabilized in the last six months or so:

Continue reading “Average daily oil production in North Dakota down 0.98% in May 2017”

More graphs of North Dakota oil production in April 2017

Yesterday’s post described the 2.4% increase in North Dakota oil production. Here are a few more graphs to tell the story.

Here is the average sweet crude price in the state by month:


Continue reading “More graphs of North Dakota oil production in April 2017”

Oil production in North Dakota up 2.4% in April 2017

Big increase in production in the state. Increase of 2.43%, from average of 1,025,690 bopd in March (revised) to 1,050,630 bopd in April (preliminary). That is the highest average production since March 2016. The April production was only 160,700 below the high water mark of 1,207,276 bopd in July 2015.


That upslope since last fall is not quite what OPEC+Russia had in mind.

Million Dollar Way pointed out the production increased at the same time as the number of inactive wells increased and the fracklog increased. I sure don’t understand the dynamics.

Producing wells increased 122 to 13,434; fracklog increased 141 to 830; inactive well count increased 167 to 1,466. Some of that is a recovery from drops in March.

Here is another graph of production, for a longer term perspective:

Continue reading “Oil production in North Dakota up 2.4% in April 2017”

News from Bakken oil patch

Rig in western North Dakota. Photographer was given tour of site resulting in many nice photos. “Oil Rig” by Lindsey G is licensed under CC BY 2.0

A few tidbits from western North Dakota:

  • More signs of a rebound
  • Amy Dalrymple joins staff of Bismarck Tribune
  • Dakota Access Pipeline begins commercial operations

6/3/17 – Star Tribune – North Dakota oil industry shows signs of a rebound – Drilling and employment is picking up in the North Dakota oil patch. Article illustrates this by telling the tale of several guys who have been out of work for a while but have been rehired.

Several analysts are quoted saying the industry is bouncing back.

Interesting stats in the article:

  • An oil rig is 13 stories tall, weighs 275 tons, and costs somewhere between $50,000 and $70,000 per day to operate.
  • Rig count: 51 now, 218 at high point in December 2012, 27 at low point in May 2016.
  • Oilfield employment in the state is 16,400 in April 2017, which is up 10% over same month in 2016.
  • Online postings for open jobs were at the highest in April over the last year and are up 94% from prior year. A trade group representative says there are likely 1,000 open oil jobs in western North Dakota.
  • Total production in Bakken is down 1.5% in the last 12 months. Meanwhile production in the Permian basin is up 25% in the last year.

Efficiency drivers:

Continue reading “News from Bakken oil patch”

Various updates from Bakken

Another dozen reasons OPEC is in distress. Two reasons are quite visible. Another 10 reasons are the open spaces on that large pad where additional wells are going to be drilled someday. Notice the large number of storage tanks, which is far more than what’s needed for just 2 wells. Photo by James Ulvog.

Here is a variety of news tidbits I’ve noticed lately from Bakken:

  • airport construction underway
  • lots more jobs opening up
  • EURs now in range of a million barrels of oil
  • oil starts flowing through DAPL
  • frac sand mines running full steam ahead

4/14/17 – The Million Dollar Way – New Airport Work to Begin Next Week – Official groundbreaking ceremony was in October 2016. The start of massive grading and site work starts the week of April 17, 2017.

4/14/17 – Amy Dalrymple at Oil Patch Dispatch – ND Oil Production Up 5 Percent; Bakken Needs 1,000 Workers to Fill Oil Jobs, Regulator Says – Mr. Lynn Helms, director of the Department of Mineral Resources was surprised by the 5% increase in production in February.

He expects aggressive drilling in the summer, after a lull in the spring due to load restrictions.

Continue reading “Various updates from Bakken”

North Dakota oil production steady in March ’17

Average daily oil production dropped 0.83% in March, from 1,034,248 bopd (revised) to 1,025,638 bopd (preliminary). Director’s report for the month is not out as of the time of posting this discussion. This month, I’ll just show two graphs of production:


Here is a longer term view:

Continue reading “North Dakota oil production steady in March ’17”

Graph of daily rig count in North Dakota

Training rig in Williston. September 2015 photo by James Ulvog.

I’ve been watching the tally of daily rig count for a while. When I think about it, I jot down the count listed at The Million Dollar Way blog.  Occasionally, as in every few months, I post my tallies.

By the way, if you have even the slightest interest in my comments on my blog you really, really, really need to read MDW.

Decided to put all that data into a graph to help me see the trends from another direction. So, I combined all the data that has been accumulated haphazardly over time and put it in a graph.

If it helps you see some patterns, I’ll share my graph.

Keep a few things in mind:

  • The data is accumulated when I think of jotting it down, so this is not a complete database
  • Don’t read anything in to the gaps in data
  • Data hasn’t been double-checked, so there are likely inaccuracies
  • This shows general trends
  • The efficiency of drilling and total output from a well has improved radically in the last few years so data is not comparable over long terms


Having undercut my data and graph, here is a picture of the rig count in the state:

Continue reading “Graph of daily rig count in North Dakota”

Volume and value of oil production in North Dakota for the last several years

Where you see one well today, eventually there will be 4 or 8 or 12. That concept and the above photo are yet more illustration of why Bakken, Eagle Ford, and Permian Basin, are strategic threats to OPEC. October 2013 photo by James Ulvog.

Let’s look at some longer term graphs of oil production in North Dakota and the value of that production. Here is a view of the annual oil production in the state:

The fascinating insight from that graph is production did not drop in 2015.

Continue reading “Volume and value of oil production in North Dakota for the last several years”

Swings in oil prices and rig count in North Dakota

There is enough untapped oil under the ground for a whole bunch more of those rigs to work in North Dakota. October 2013 photo by James Ulvog.

If  you want to see one graph that explains the swings of drilling and oil production in North Dakota, take a look at this:

The price of oil for producers in the state collapsed in late 2014 due to the OPEC decision to increase production. The price recovered a bit in mid-2015 but continued to drop into the 20 something range.

The price has been steadily trending up, albeit slowly, since mid-2016.

That graph can then explain a lot of other trends.

For example, look at the count of average rigs in operation. The tally dropped dramatically in 2015. It has slowly been recovering since fall of 2016.

Continue reading “Swings in oil prices and rig count in North Dakota”

Recent counts of drilling rigs in North Dakota

Drilling rig at dawn. Photo by James Ulvog.

The count of drilling rigs in operation across the state has shown strong increase since fall ’16.

Here is a recap of the North Dakota rig count, all from Million Dollar Way. It has been a while since I posted an update.

Keep in mind that the dramatic increase in productivity and production per well means that the number of rigs isn’t anywhere near as important as it was several years ago. At the same time, the count of rigs is still one indicator of activity. Perhaps the long-term trends aren’t important while the shorter term trends are.

Keep in mind I gather data when I think to make notes on the count. Also, I haven’t double checked the numbers, so there very well could be some errors.

Continue reading “Recent counts of drilling rigs in North Dakota”

Updates on Bakken

Gotta’ get that well back in production. Crew on workover rig working well after dark. Photo by James Ulvog.

Here are four articles providing a bit of background on what’s going on in Bakken.

You have likely noticed I have long relied on The Million Dollar Way for my education on oil in general and Bakken in particular. Just look at the source for the following four articles. That makes it sorta’ cool when on 3/22 MDW recommended my post Scratching my head at the geopolitical impact of fracking. Thanks for the mention!

2/19/17 – The Million Dollar Way – EURs – Bakken 2.0 – EUR means Estimated Ultimate Recovery, which is the total amount of oil expected to be extracted from one specific well.  Article says the EURs in Bakken were 300K early on. At the point I started paying attention, the EURs were in the 500K range with possibilities of 1,000K.

Article says Mike Filloon has been talking about 1.5M instead of 1.0M.

Now the article lists 14 wells with EURs of 1.5M up to 2.0M EURs.

Continue reading “Updates on Bakken”