More October data on North Dakota oil production

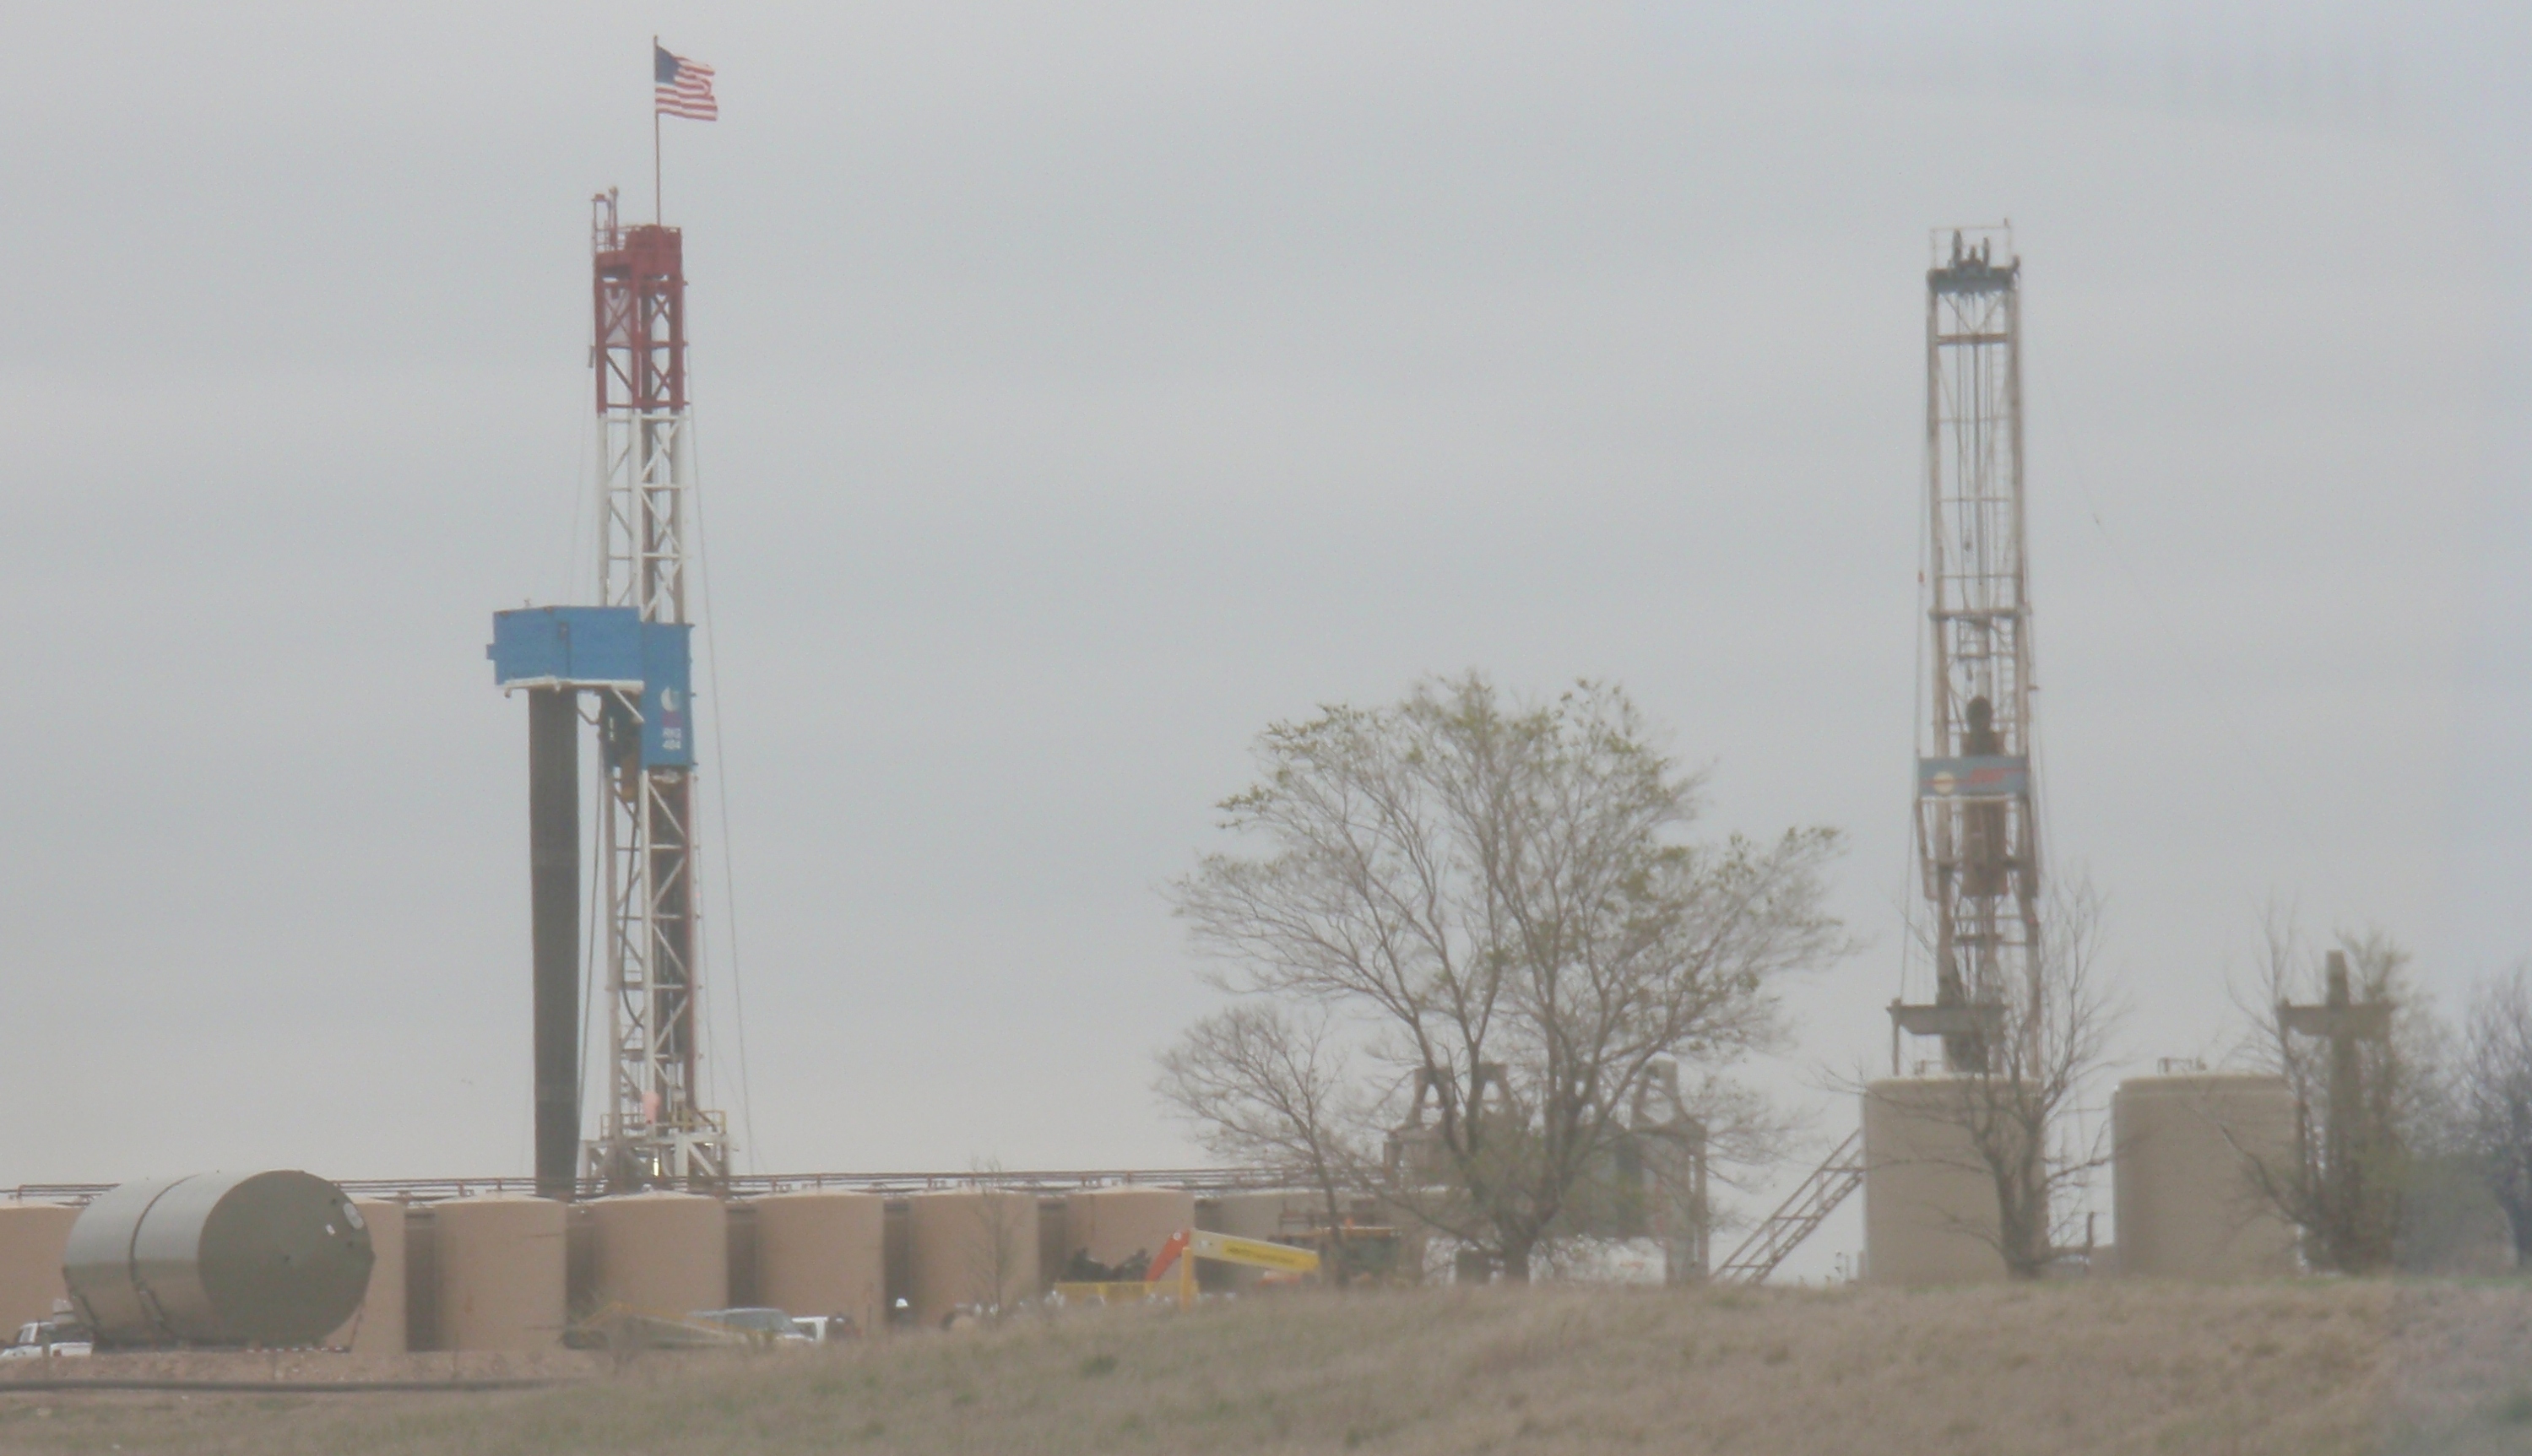
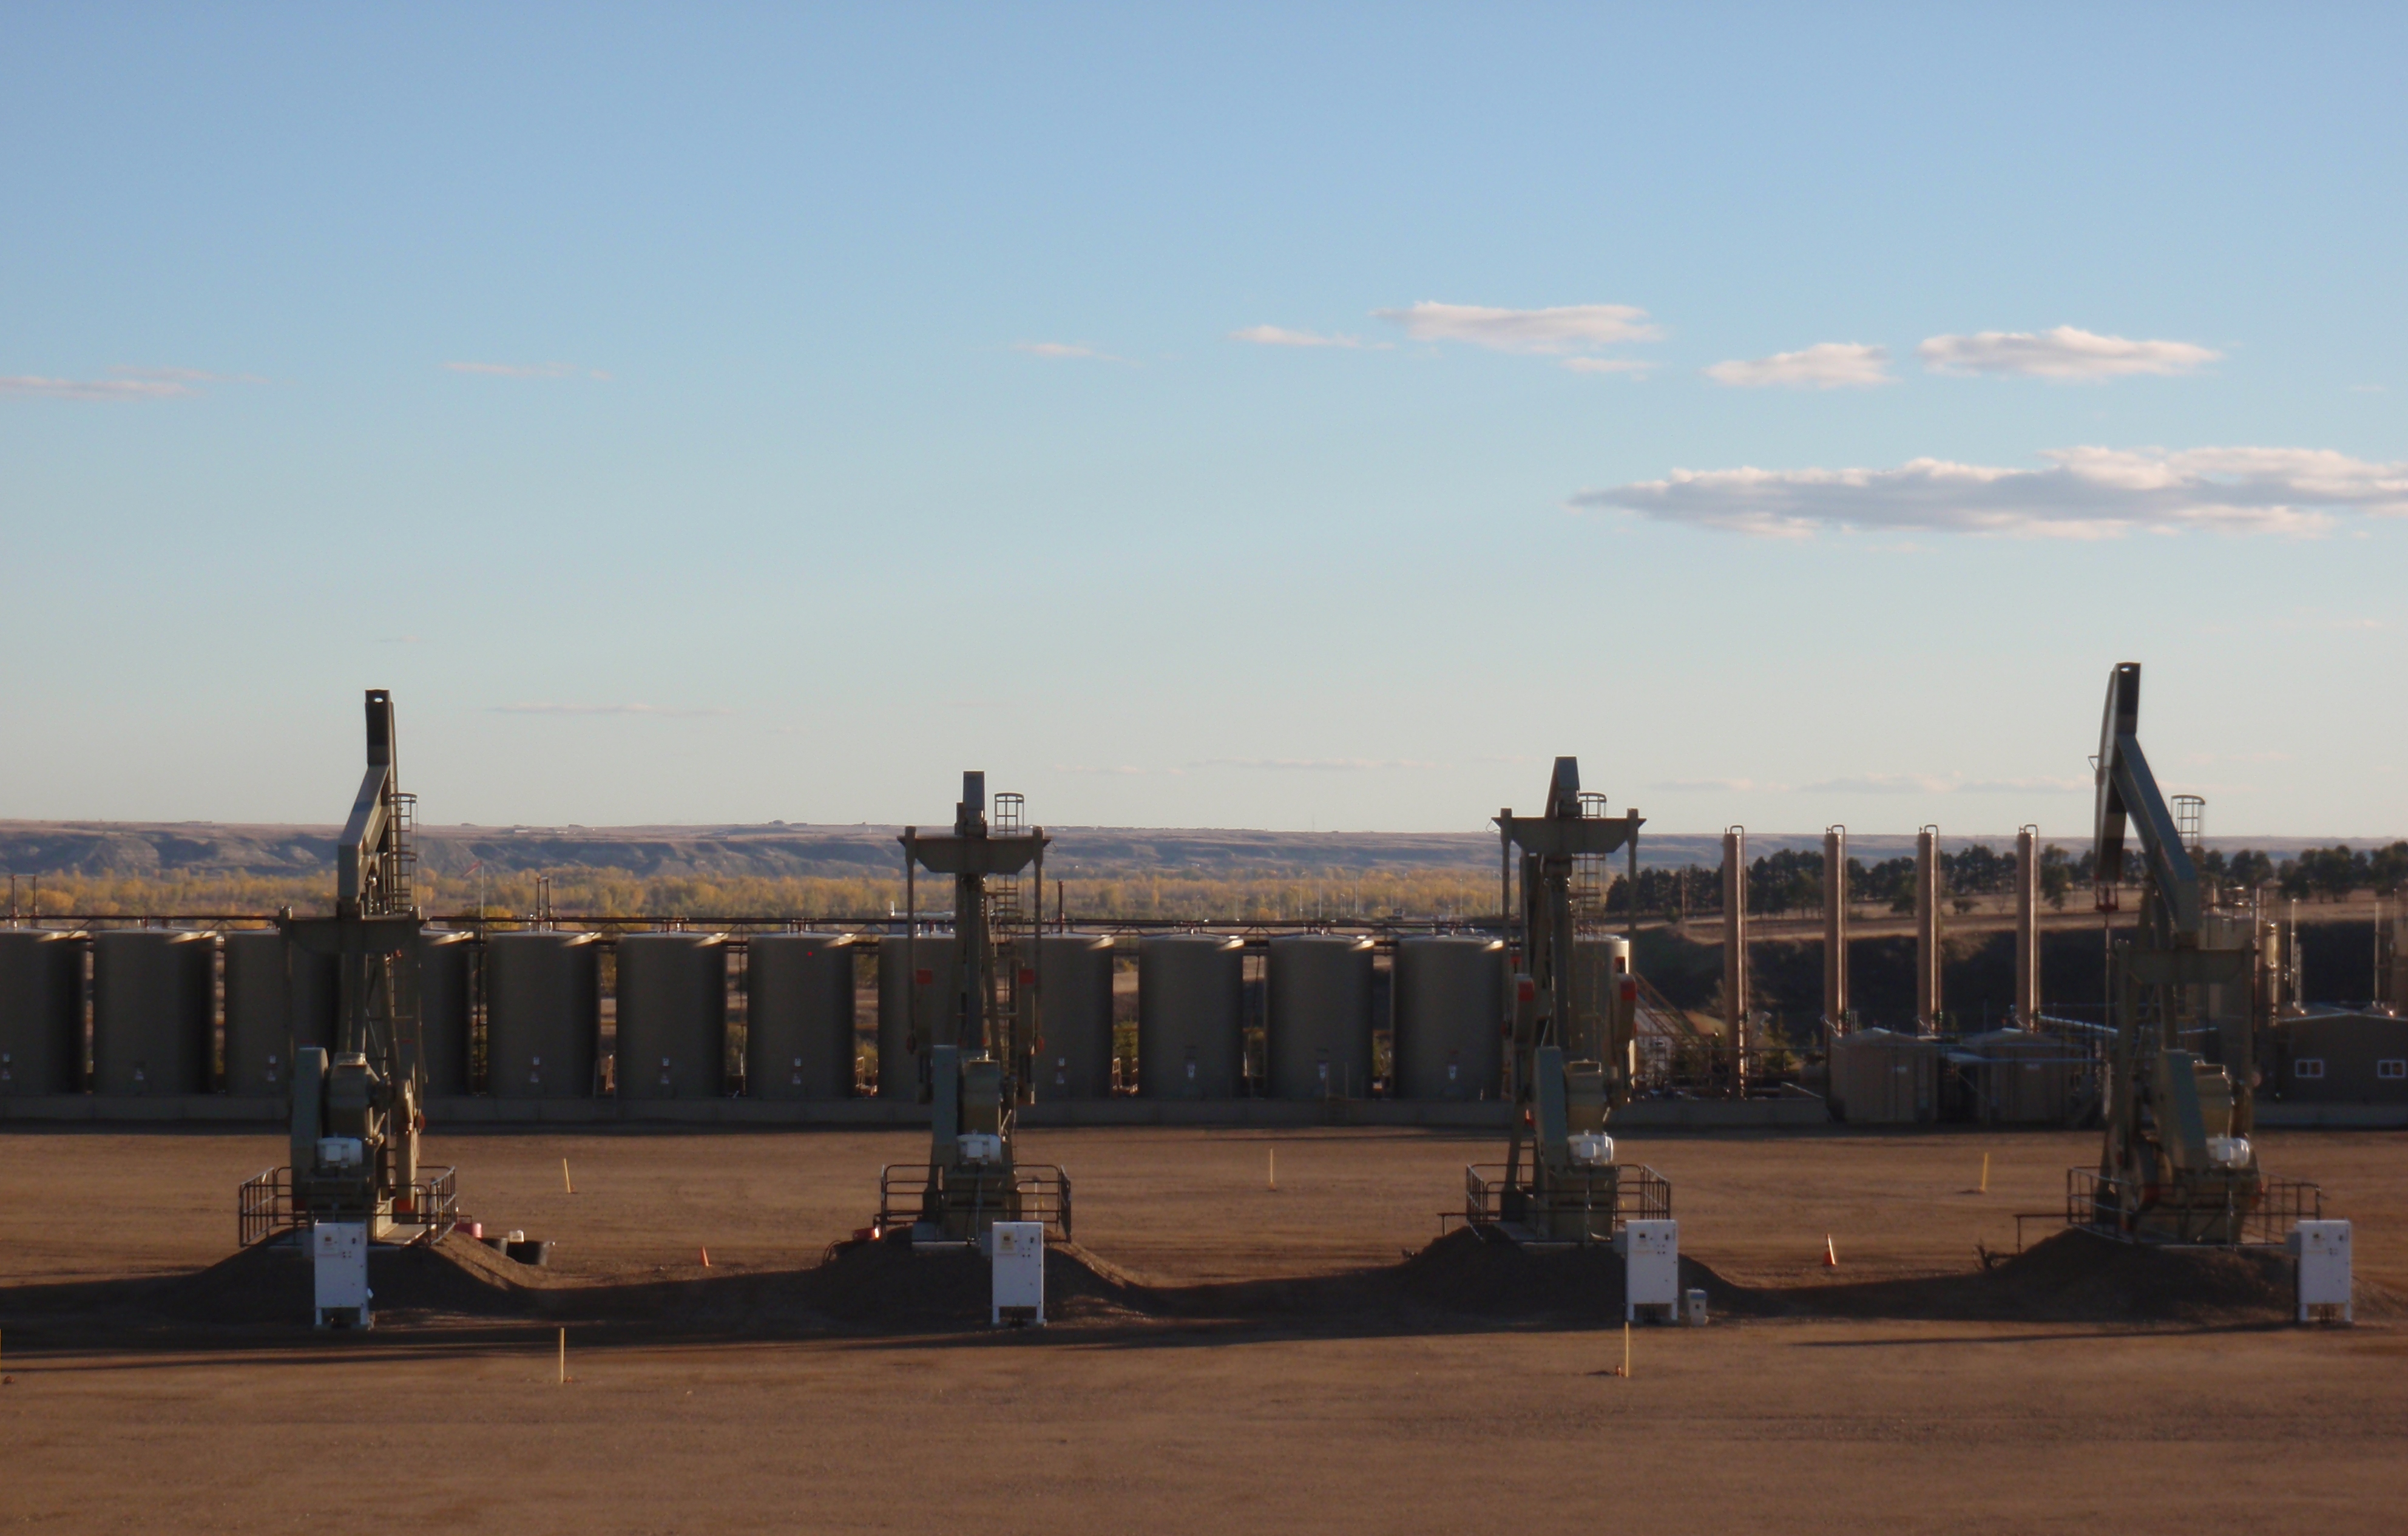
Notice the large amount of empty space on that pad? There will be a lot more wells there eventually. Photo by James Ulvog.

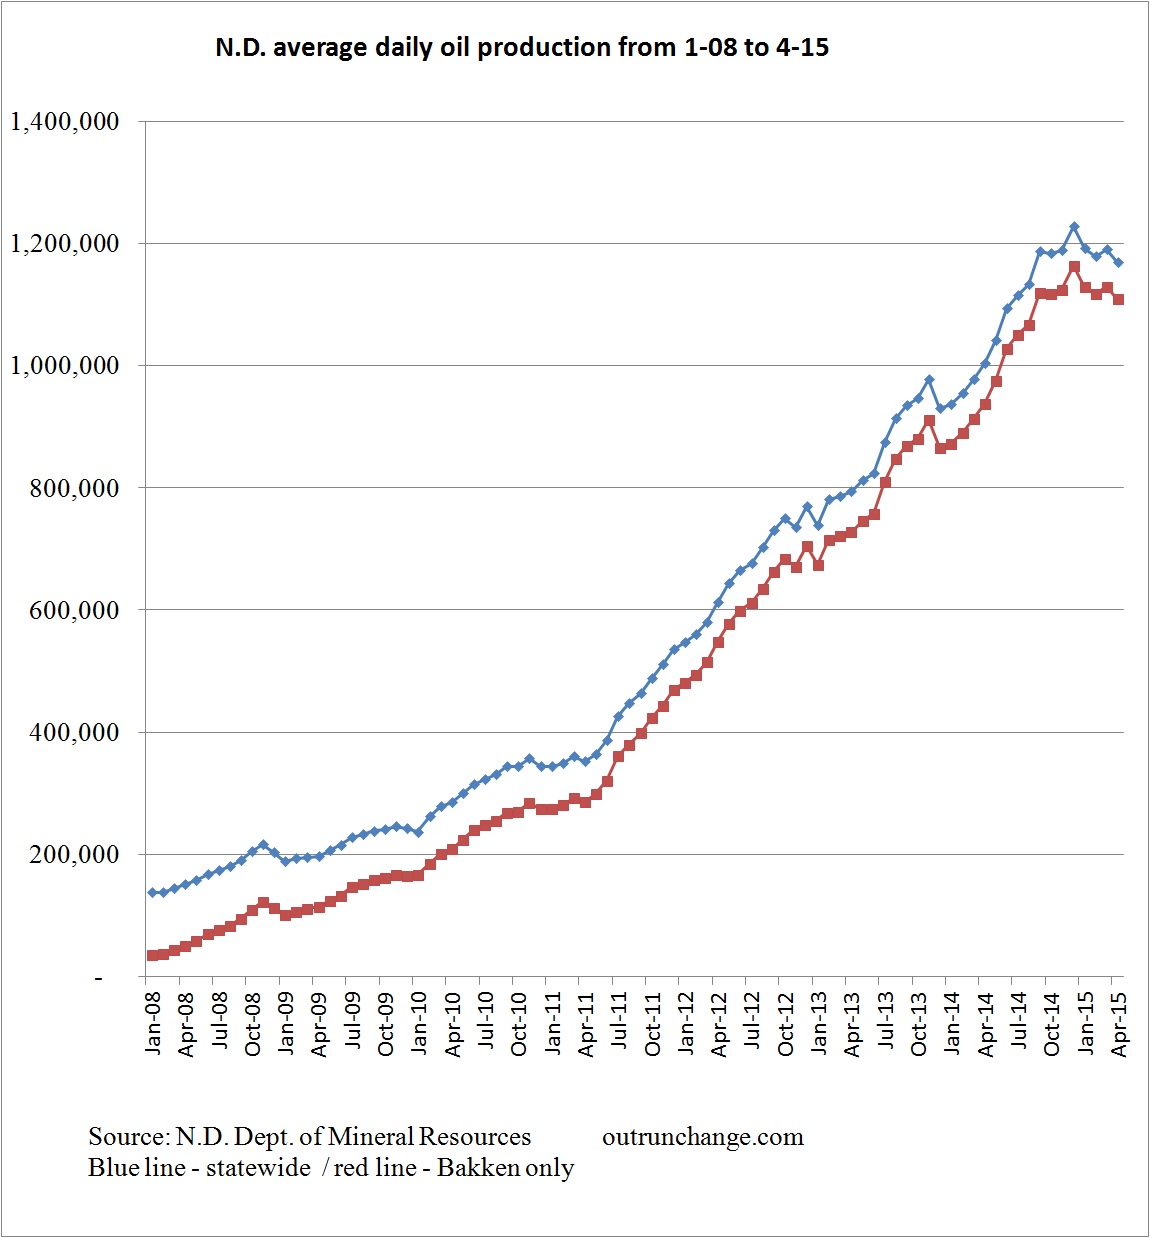
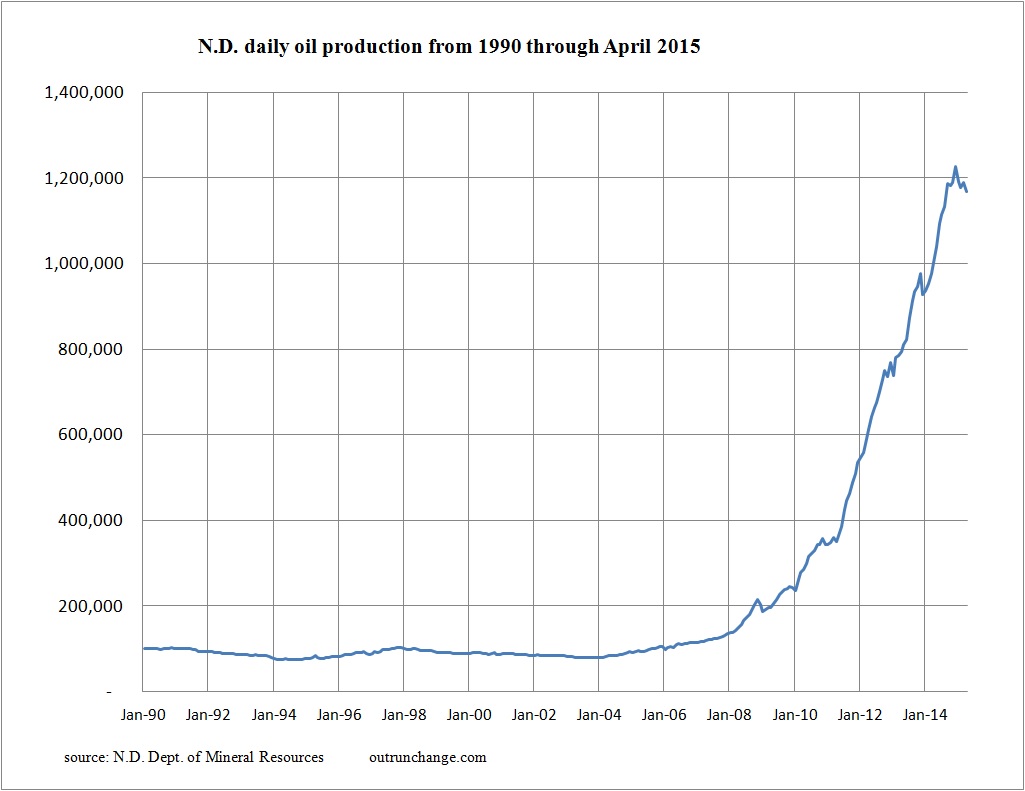
Here are a few more graphs on crude production in North Dakota:

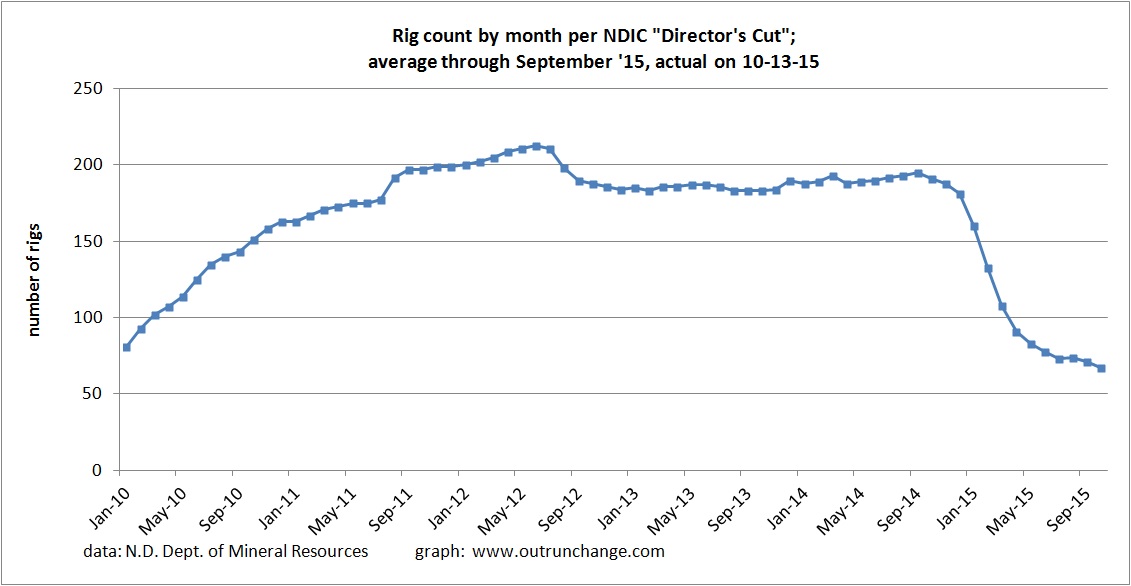
Here is the rig count info:

rig count 10-15

The count of rigs is not a big as deal today as it was a few years ago because the rig productivity has increased so much. Looking at the last 6 or 8 months seems sort of like a plateau. A slight downward trend but not a dropoff.

Here is the crude price by month: Continue reading “More October data on North Dakota oil production”

North Dakota crude production drops 1.7% in August, total drop of 3.3% since December ’15 high

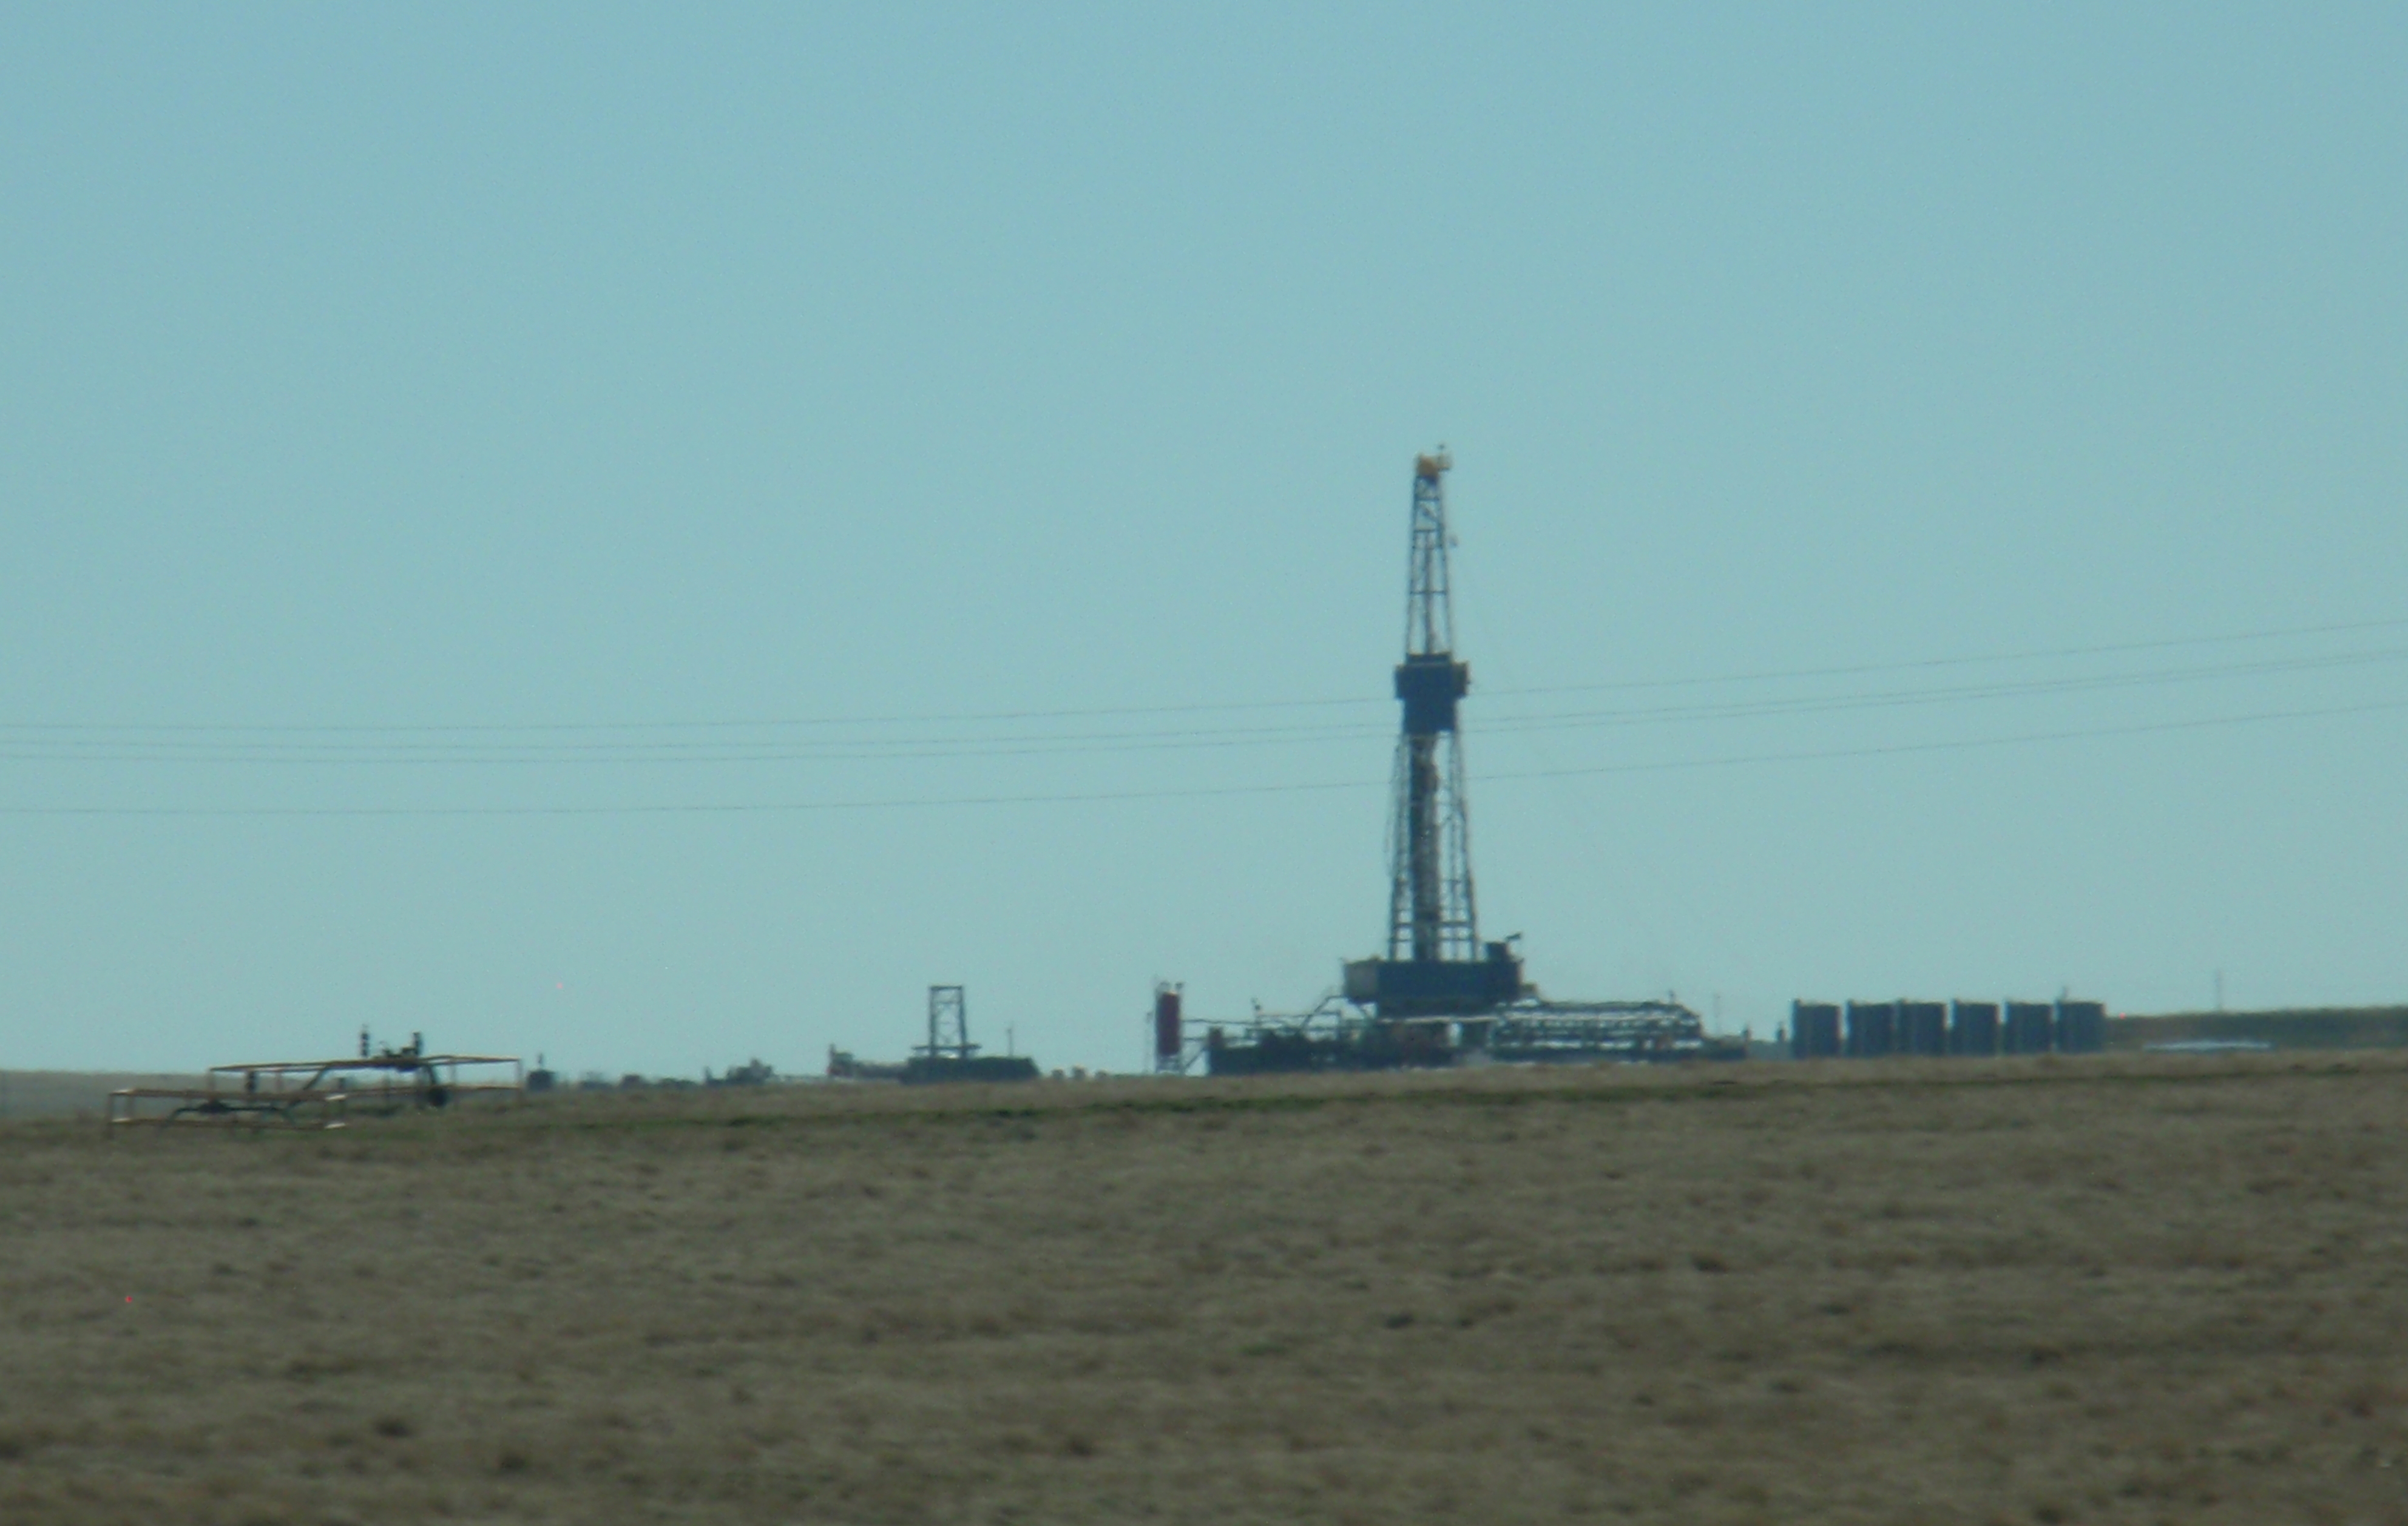
There are still a lot of rigs visible on the drive from Minot to Williston. Keep in mind that is one of the most productive areas. Photo by James Ulvog.
There are still a lot of drilling rigs visible on the drive from Minot to Williston in September 2015. Keep in mind that is one of the most productive areas. Photo by James Ulvog.

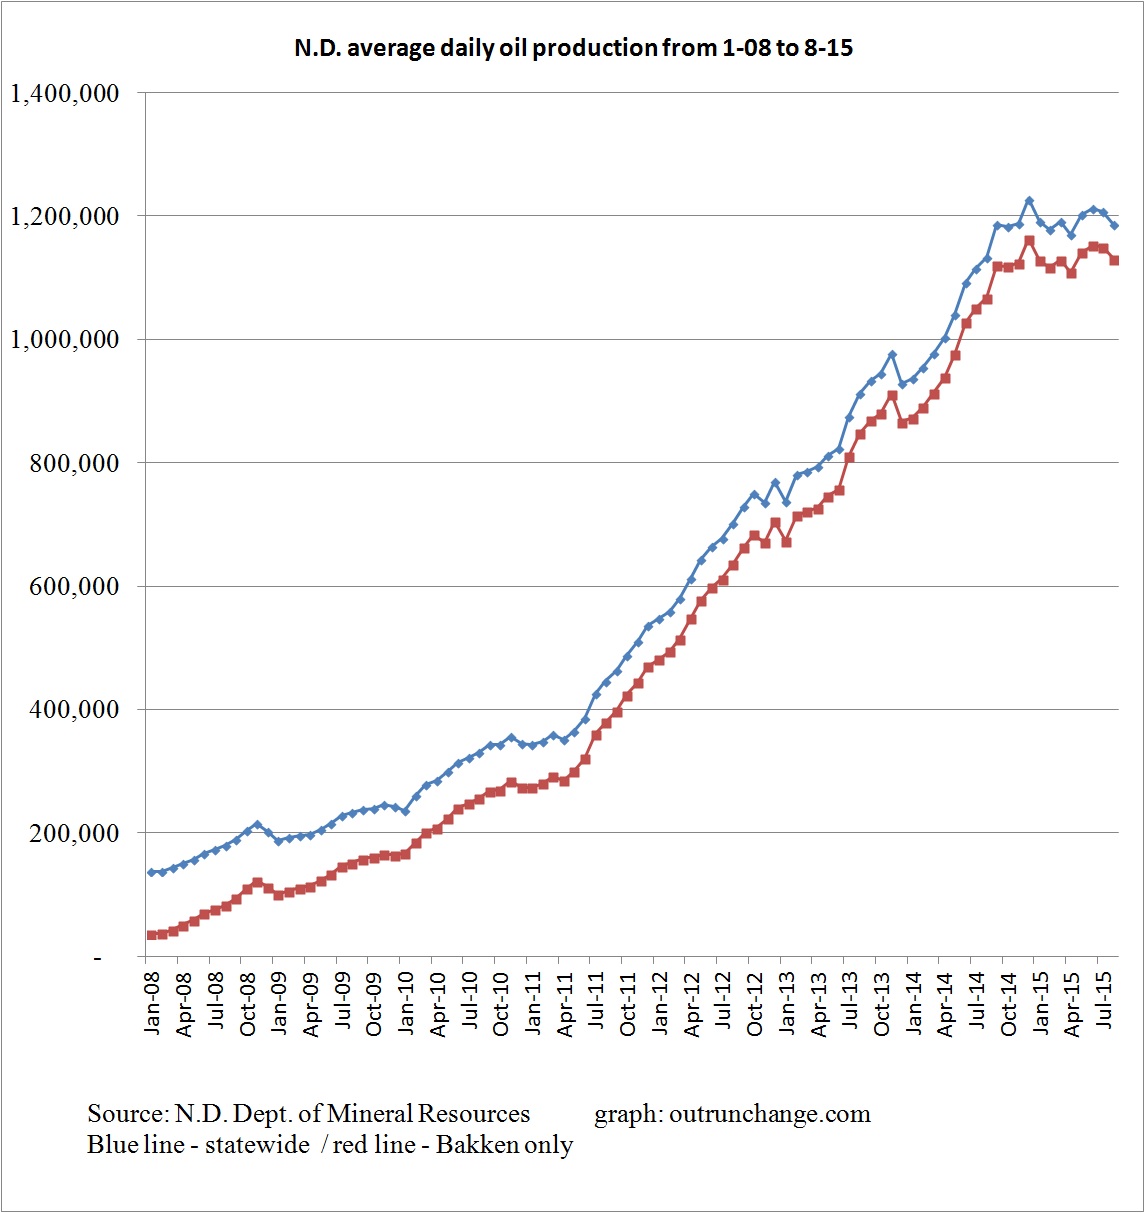
Crude oil production averaged 1,186,444 BOPD in August, which was down only 20,552 barrels a day from July. The high was 1,227,529 in December, which makes August the eighth highest production month on record.

production by month 8-15

The last 11 months look something like a plateau.

Continue reading “North Dakota crude production drops 1.7% in August, total drop of 3.3% since December ’15 high”

Higher volatility of Bakken crude is not cause of spectacular explosions

Photo of empty oil train returning to North Dakota to pick up another load of crude oil. Photo by James Ulvog.
Photo of empty oil train returning to North Dakota to pick up another load of crude oil. End of the train is not visible around the curve. Photo by James Ulvog.

It is the volume of oil released in a railroad derailment that is the reason for massive fires we’ve seen in the headlines over the last few years, not the slightly higher volatility of crude from the Bakken shale oil.

9/23 – Minot Daily News print copy, from Bismannews – Oil company officials laud findings on crude oil volatility – Research from Dept of Transportation, Dept of Energy, and Federal Railroad Administration point toward the amount of fuel spilled as the biggest factor in whether an accident involving crude oil results in a fire or explosion. Volatility of oil is not the cause.

Continue reading “Higher volatility of Bakken crude is not cause of spectacular explosions”

Two superb primers on energy

Without cheap, abundant, and reliable energy neither the construction, illumination, nor activity after dark you see here would be possible. Photo courtesy of DollarPhotoClub.com.
Without cheap, abundant, and reliable energy none of the construction, illumination, or activity after dark you see here would be possible. Photo of San Diego skyline courtesy of DollarPhotoClub.com.

I found two more in-depth discussions of energy. I’m writing this blog to help me learn what is going on around us. If you are tagging along on my learning journey, you really oughta’ check these out:

8/21 – Daniel Yergin at Wall Street Journal – The Power Revolutions /Natural gas, solar power and data-driven efficiency are making big gains, but history shows that the shift away from coal and oil won’t be fast or neat – Anything you see in print from Mr. Yergin is worth reading.

He points out that it takes an extremely long time to make any major transition in sources of energy.

Continue reading “Two superb primers on energy”

Open frontier, energy edition, 8/24

Two rigs on same pad. Photo by James Ulvog.

In spite of dropping prices for crude oil and turmoil in the energy markets, the long-term trend of abundant oil and gas is encouraging. The oil ‘glut’ isn’t going away, meaning we will have abundant crude for quite a while, and refracking may open the door to recovery of even more gas and oil.

7/6 – Bloomberg Business – Refracking Is the New Fracking – Graph of estimated production from shale oil guesses output will rise from about 2.2M bopd in 2012 to under 3.5M bopd now to 5.5M bopd each year from about 2018 to 2023. Then production will tail off to about 4.5M bopd from 2032 through 2040.

That is somewhere in the range of around 48 billion barrels of oil that was untouchable a decade ago. My untouchable I mean there-is-noway-we-will-ever-get-to-that-stuff untouchable. (Calc as a very rough average of 4.5M bopd x 365 days a year x 29 years {2040 less 2012}.)

It is possible refracking might come close to doubling that output.

Continue reading “Open frontier, energy edition, 8/24”

Crude oil production in North Dakota increases slightly in June ’15 to second highest amount ever

[youtube=https://www.youtube.com/watch?v=0ks2ua4imgU]

(Shaky videography and editing by James Ulvog)

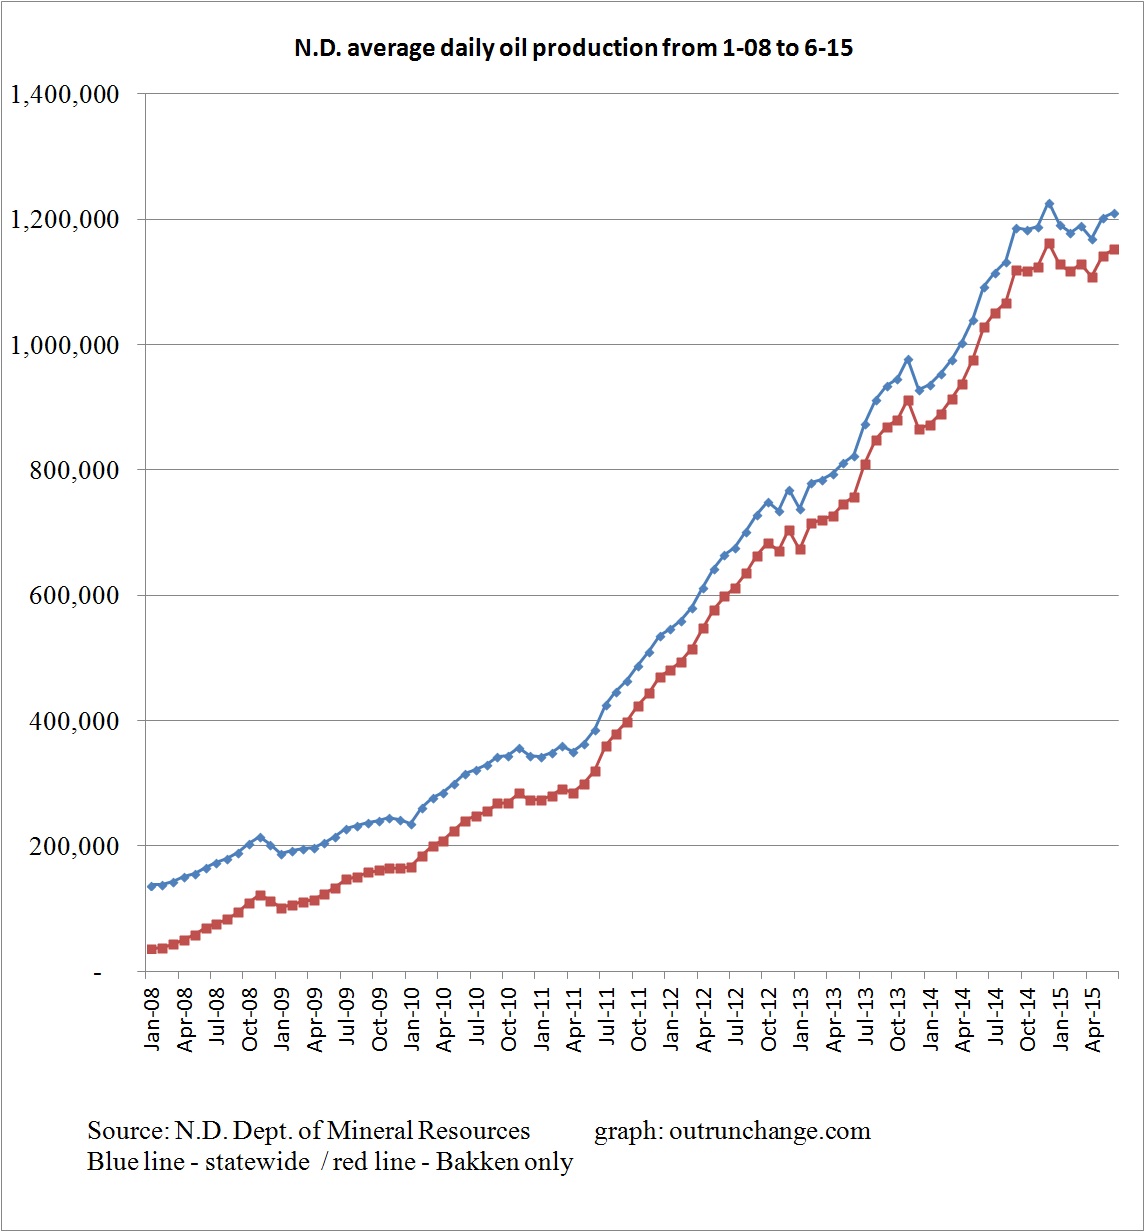
Production of crude in the state increased to 1,211,180 bopd (prelim) in June from 1,202,615 bopd (final) in May. That is up 8,565 bopd. Only  month with higher average production was December 2014 at 1,227,529 bopd.

production 6-15

Keep in mind the goal of the Saudis when they kicked off the price war was to take Bakken production off the table. I don’t think the results above are quite what they had in mind.

Continue reading “Crude oil production in North Dakota increases slightly in June ’15 to second highest amount ever”

Who will break first, Saudi Arabia or the American shale oil industry?

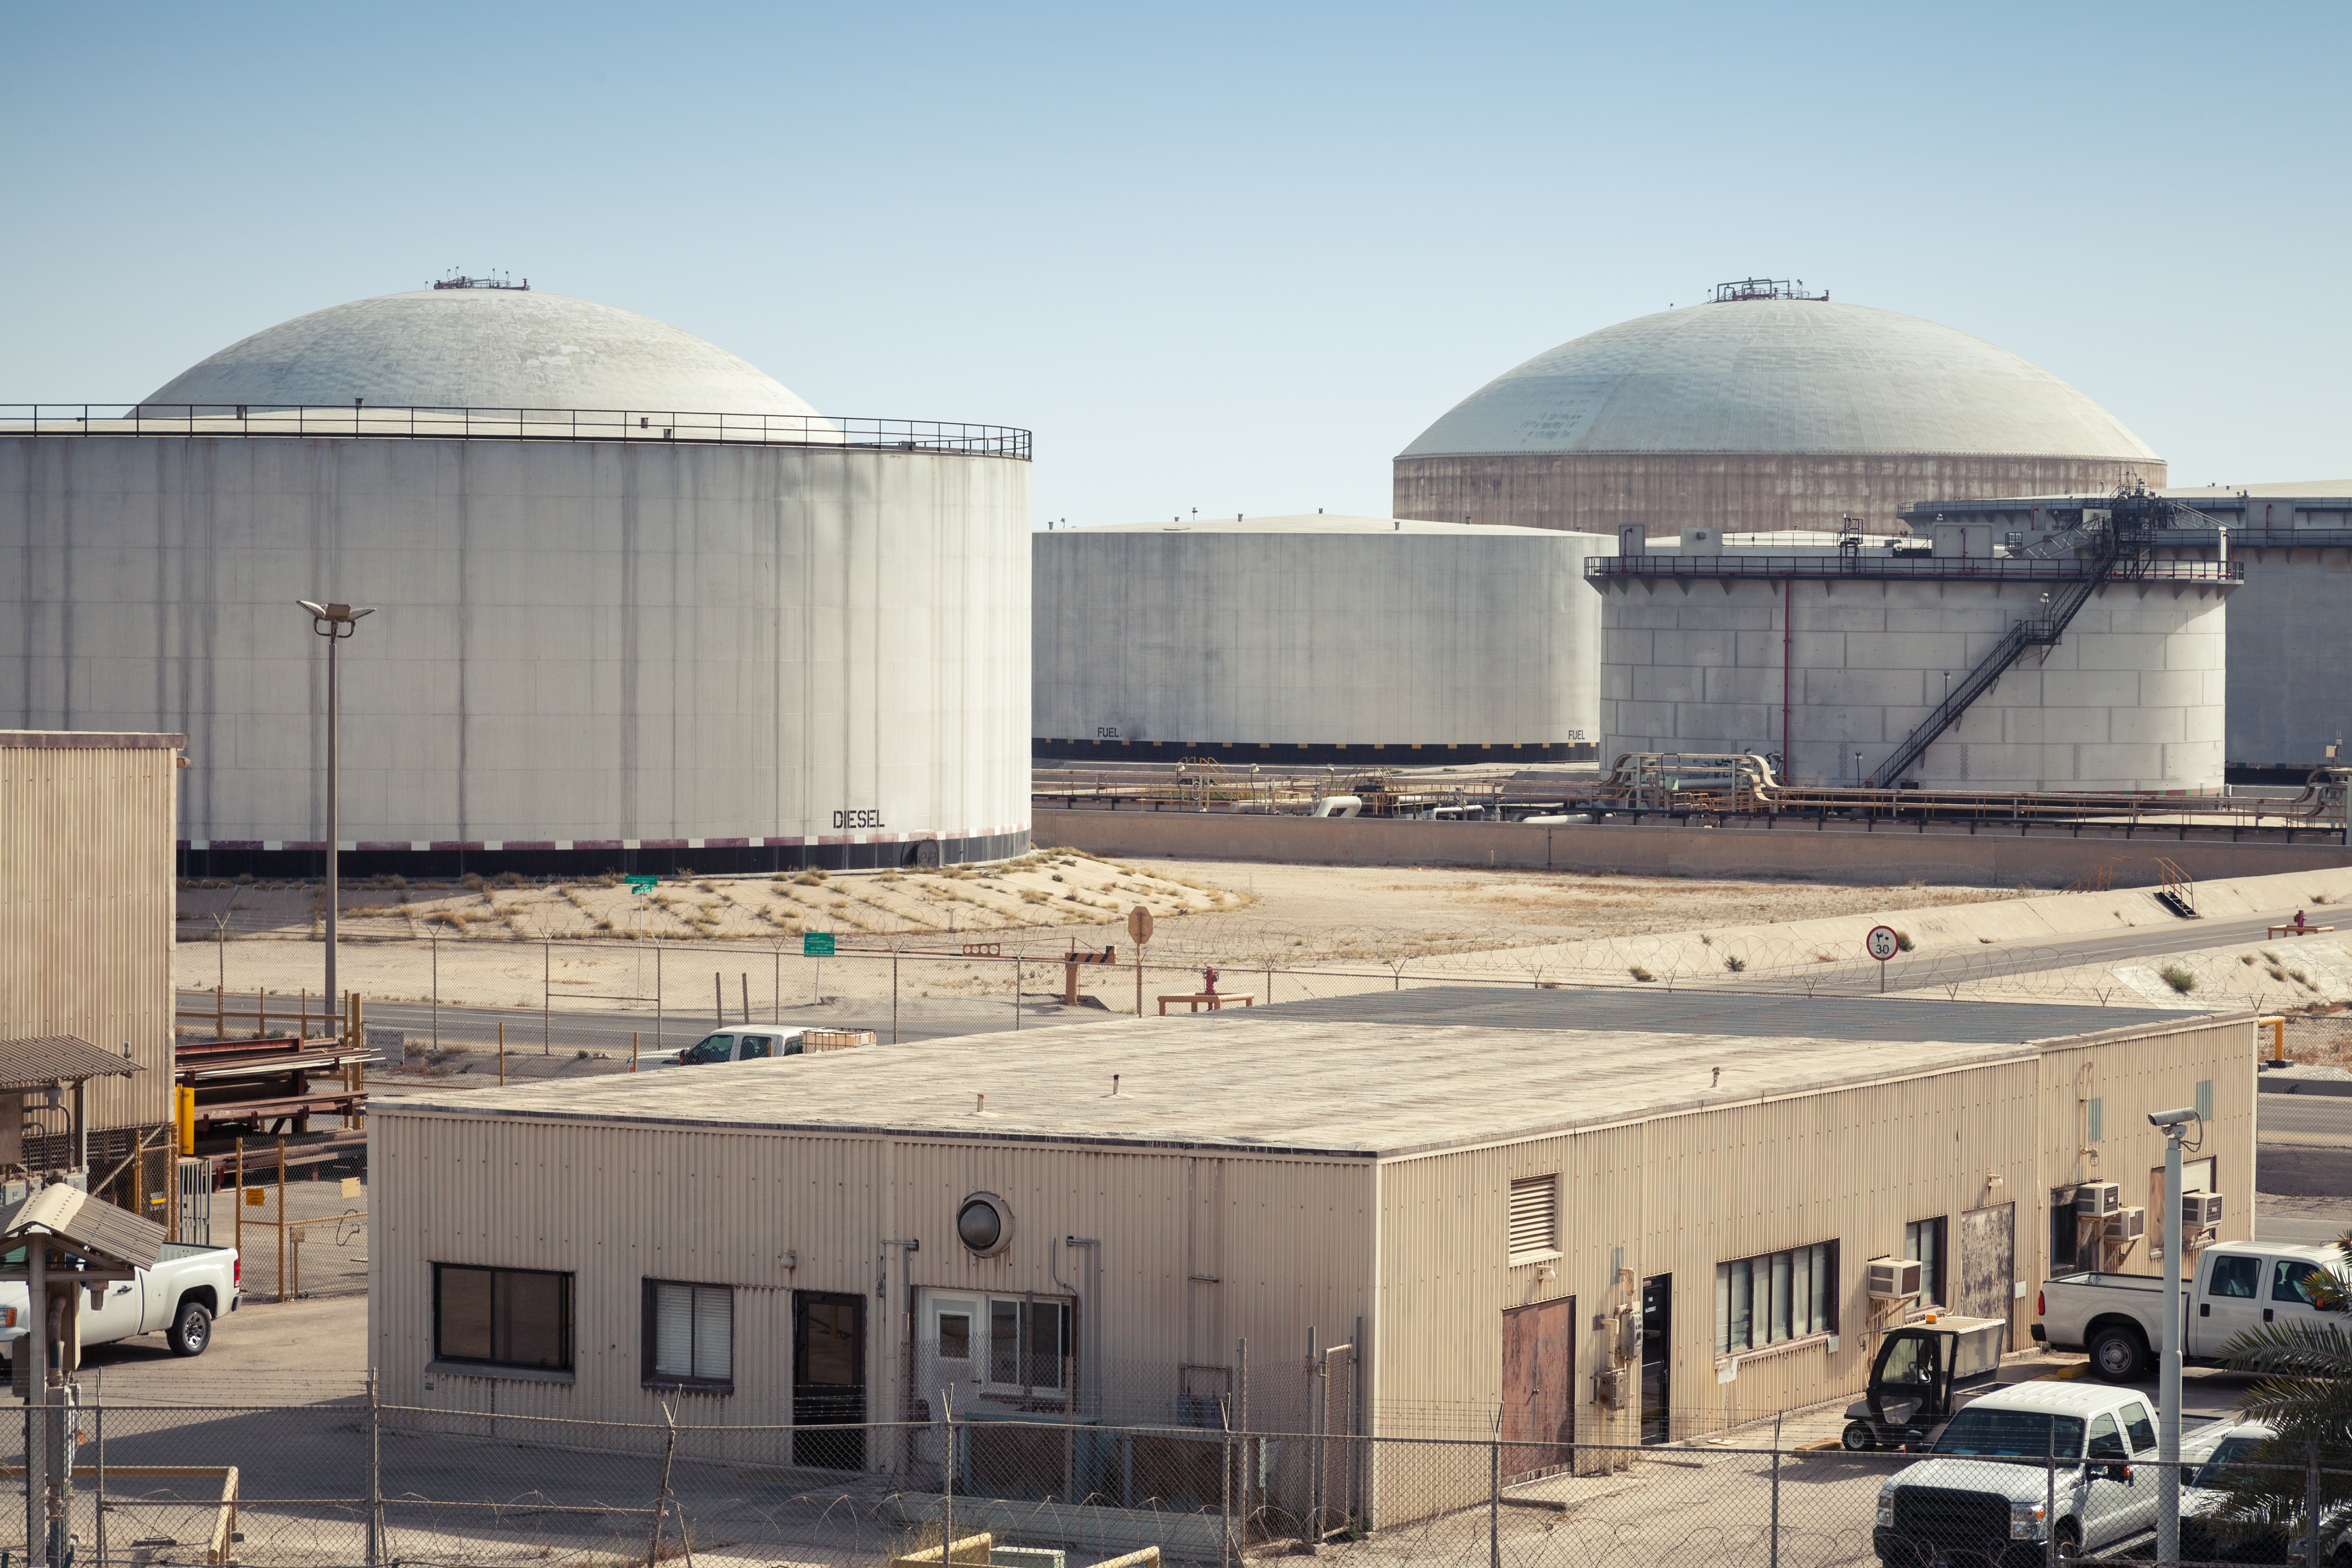
Ras Tanura oil terminal, Saudi Arabia, photo courtesy of DollarPhotoClub.com
Ras Tanura oil terminal in Saudi Arabia. Photo courtesy of DollarPhotoClub.com

VERSUS

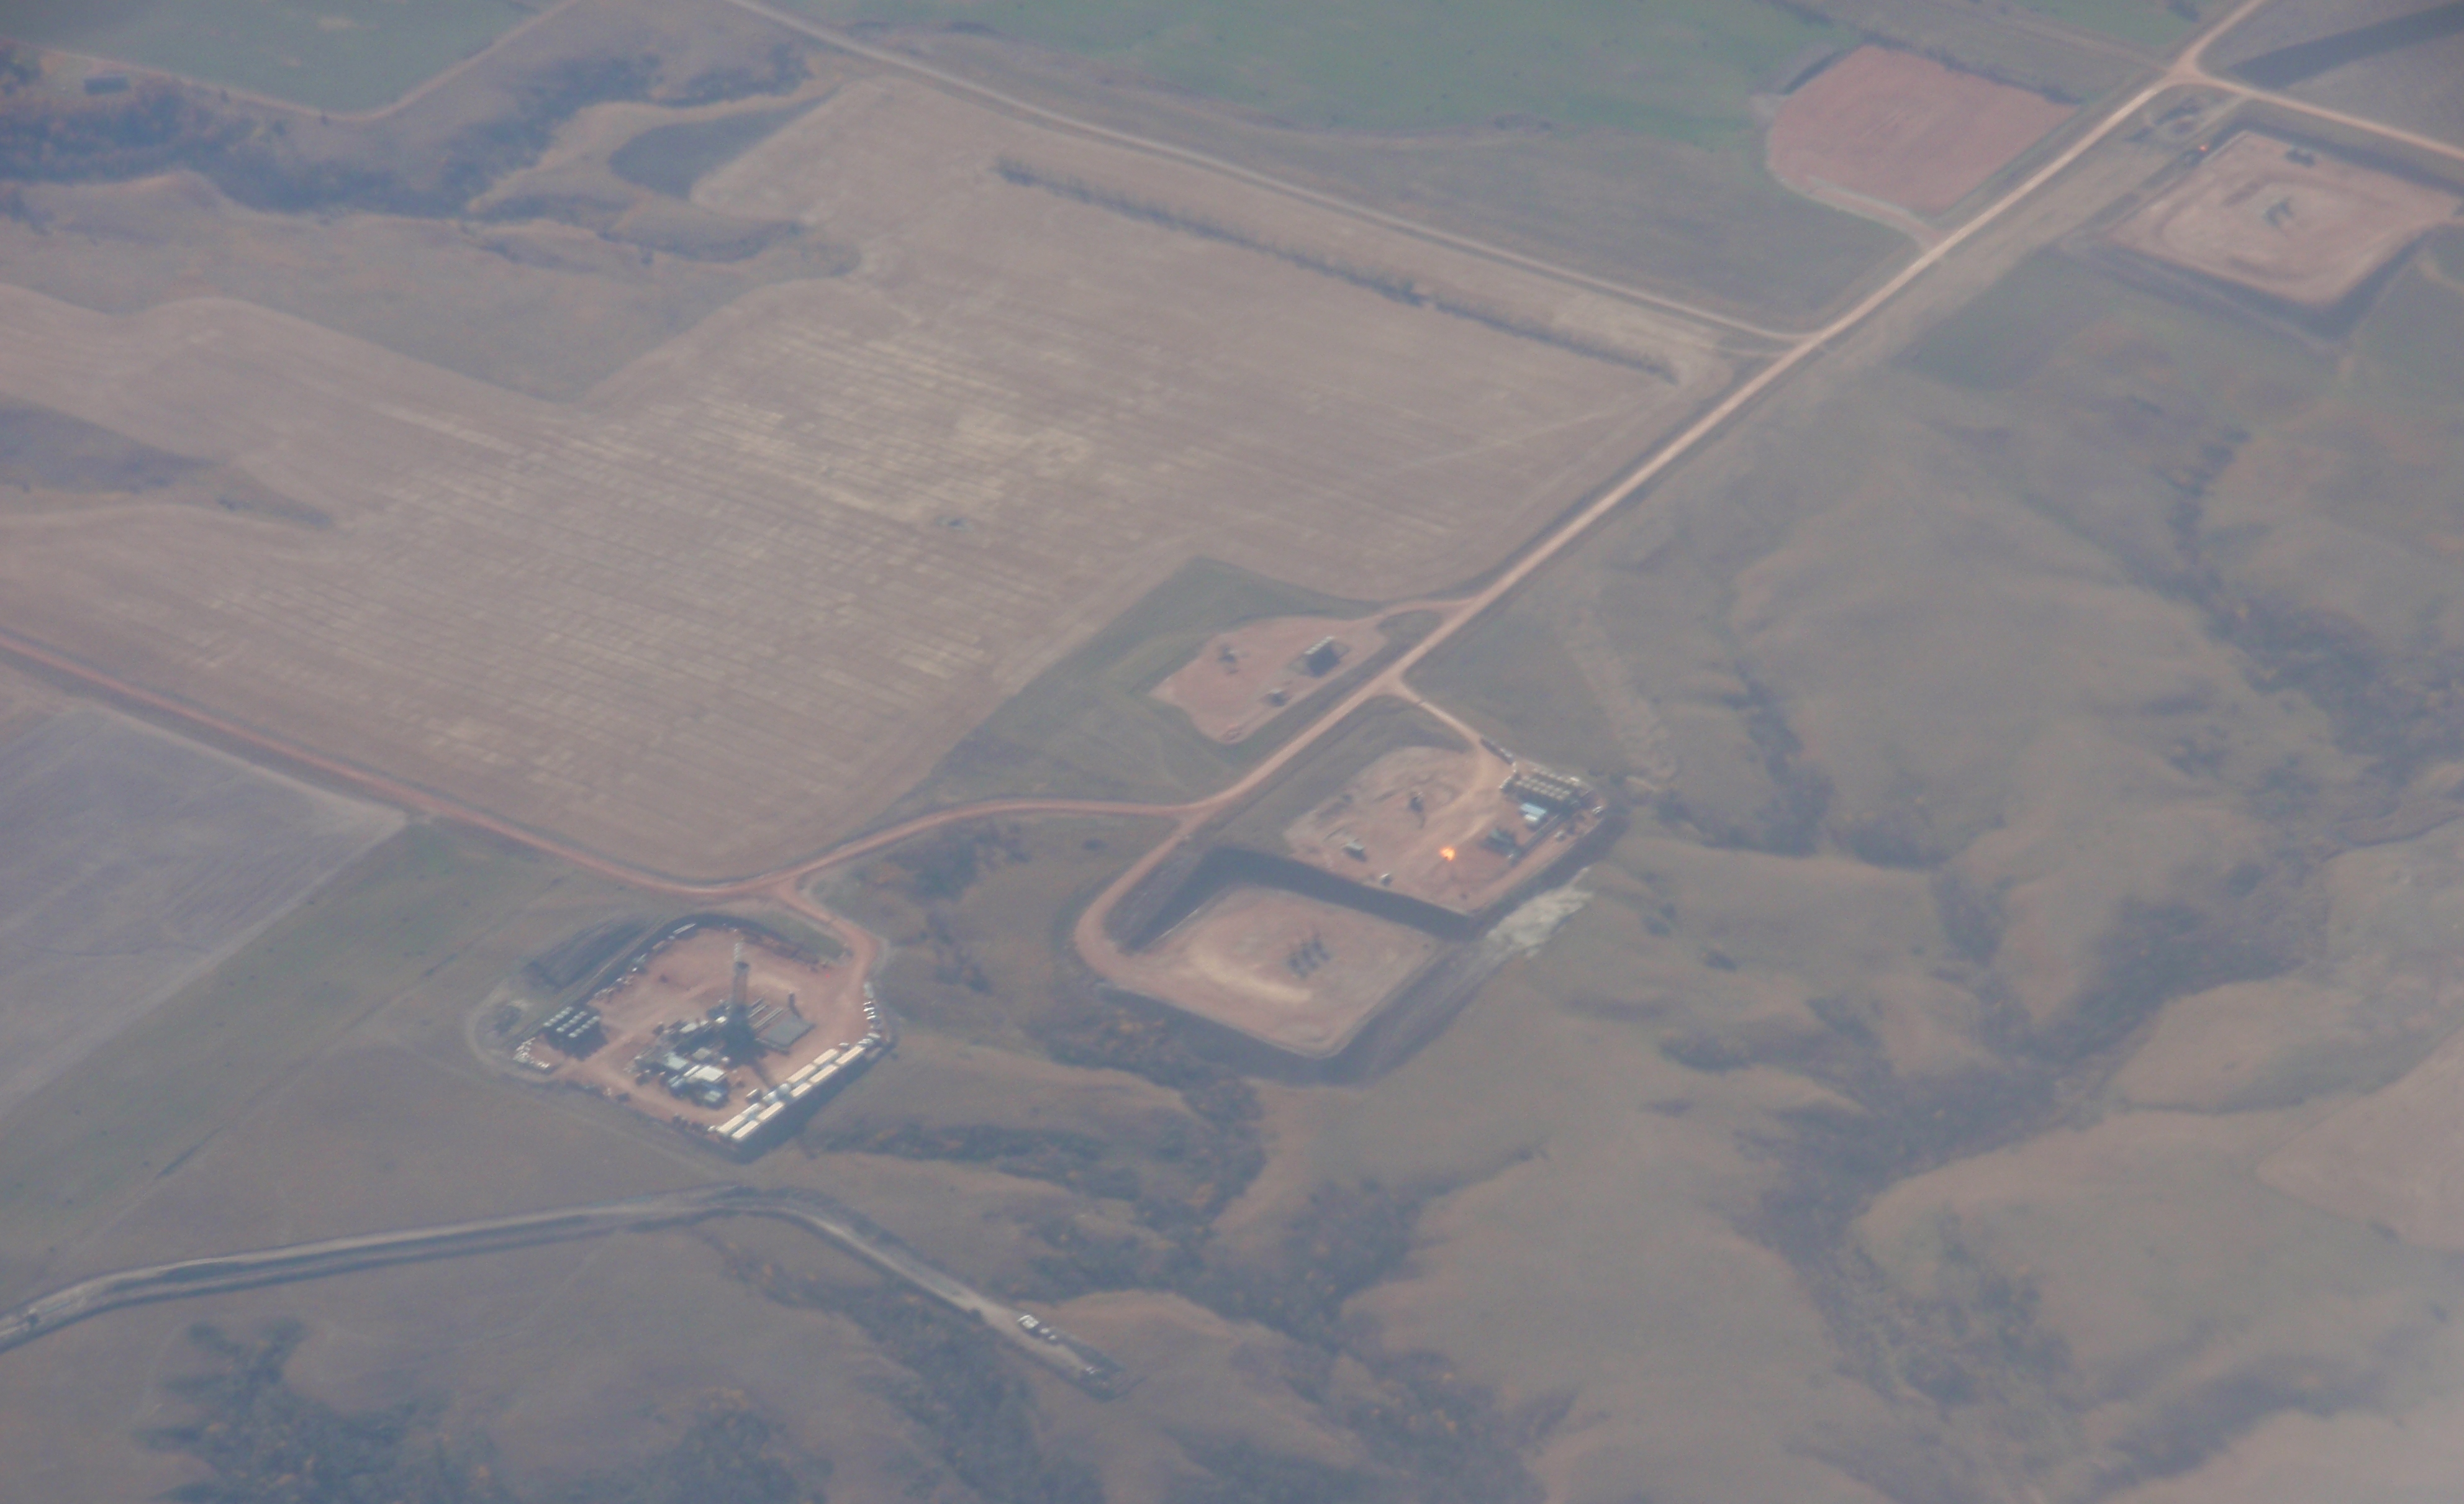
5 oil pads in North Dakota, 1 with drilling rig and one cleared ready to drill. Photo by James Ulvog
5 oil pads in North Dakota, 1 with drilling rig. Each pad may eventually have 3 or 10 wells. Photo by James Ulvog. October 2014. Yeah, yeah, I’m not much of a photographer.

Three fascinating articles to give some perspective on global oil market. Might want to get a fresh cup of coffee, this will be a long read.

From immediate appearances, Saudi Arabia is in financial distress because of low oil prices. On a longer-term perspective they are in extremely severe trouble. OPEC as an organization is essentially done. Entertaining to watch one writer tried to blow off all of the above information.

First, the immediate indication that Saudi Arabia is having serious trouble now.

8/5 – Financial Times – Saudi Arabia plans $27bn in bond issues – Saudi Arabia has already borrowed $4B in the bond market. They are floating ideas of borrowing $5.3B a month through the end of the year for an additional $27B debt.

With selling around 10.3M barrels a day at price of around $50 which produces somewhere around $188B a year, why are they tiptoeing back into the debt market?

Continue reading “Who will break first, Saudi Arabia or the American shale oil industry?”

A few more tidbits on rising oil production in North Dakota – 5/15

Each month after the statistics are released for North Dakota oil production, I run a few graphs showing the story of what is going on there.

Here are a few more for May 2015.

Average number of producing wells by year. This is the number of producing wells in the statistics, here and here, with my calculation of the average of the monthly amounts. You can see a breakout in 2010 and 2011. The huge increases are in ’12, 13, and ’14. Even with the slump in prices, which led to a drastic drop in the number of drilling rigs, the average number rigs in ’15 has increased more than any year prior to ’12. Continue reading “A few more tidbits on rising oil production in North Dakota – 5/15”

North Dakota oil production hits second highest level ever in May 2015

Production state-wide rose 2.75% to average of 1,201,159 barrels per day. That is the second highest ever, only behind December 2014 which was 1,227,529 bopd. Keep in mind this is with a slump in drilling.  I’m guessing that flat production is not what the OPEC ministers were expecting when opened the spigots of their production.

Here is what the average production looks like in Bakken field only and state-wide: Continue reading “North Dakota oil production hits second highest level ever in May 2015”

What do the economics of one Bakken well look like?

OLYMPUS DIGITAL CAMERA
Two traditional pump jacks aside two of Chinese design. Photo by James Ulvog. I see two or three million barrels of oil from that pad over the next few decades.


Prof. Mark Perry pulled together some estimates on the economics of a Bakken well in North Dakota in his post Top ten things I learned on my summer trip to the Bakken oil fields, Part II. Previously discussed Part I and Part II.

Here was his data:

Average cost to drill, frack and complete a Bakken oil well: $9 million

Expected production life of a Bakken oil well: 45 years

Lifetime oil production per well: 615,000 barrels

Expected lifetime revenue generated per well: $46.125 million at $75 per barrel

Total operating expenses per well: $2.3 million

Royalty payments to mineral owners per well over 45 years: $7.3 million

Taxes Paid per well: $4.325 million total ($2.1 million gross production taxes, $1.8 million extraction tax and $425,000 in sales taxes)

Total employee salaries and wages per well: $2.125 million

Average Profits Generated per Bakken well: $20 million net of costs and taxes

Let me rework those numbers –

This is a really rough guess of what the lifetime income statement might look like for one well: Continue reading “What do the economics of one Bakken well look like?”

More great things to learn about Bakken – part 2

OLYMPUS DIGITAL CAMERA
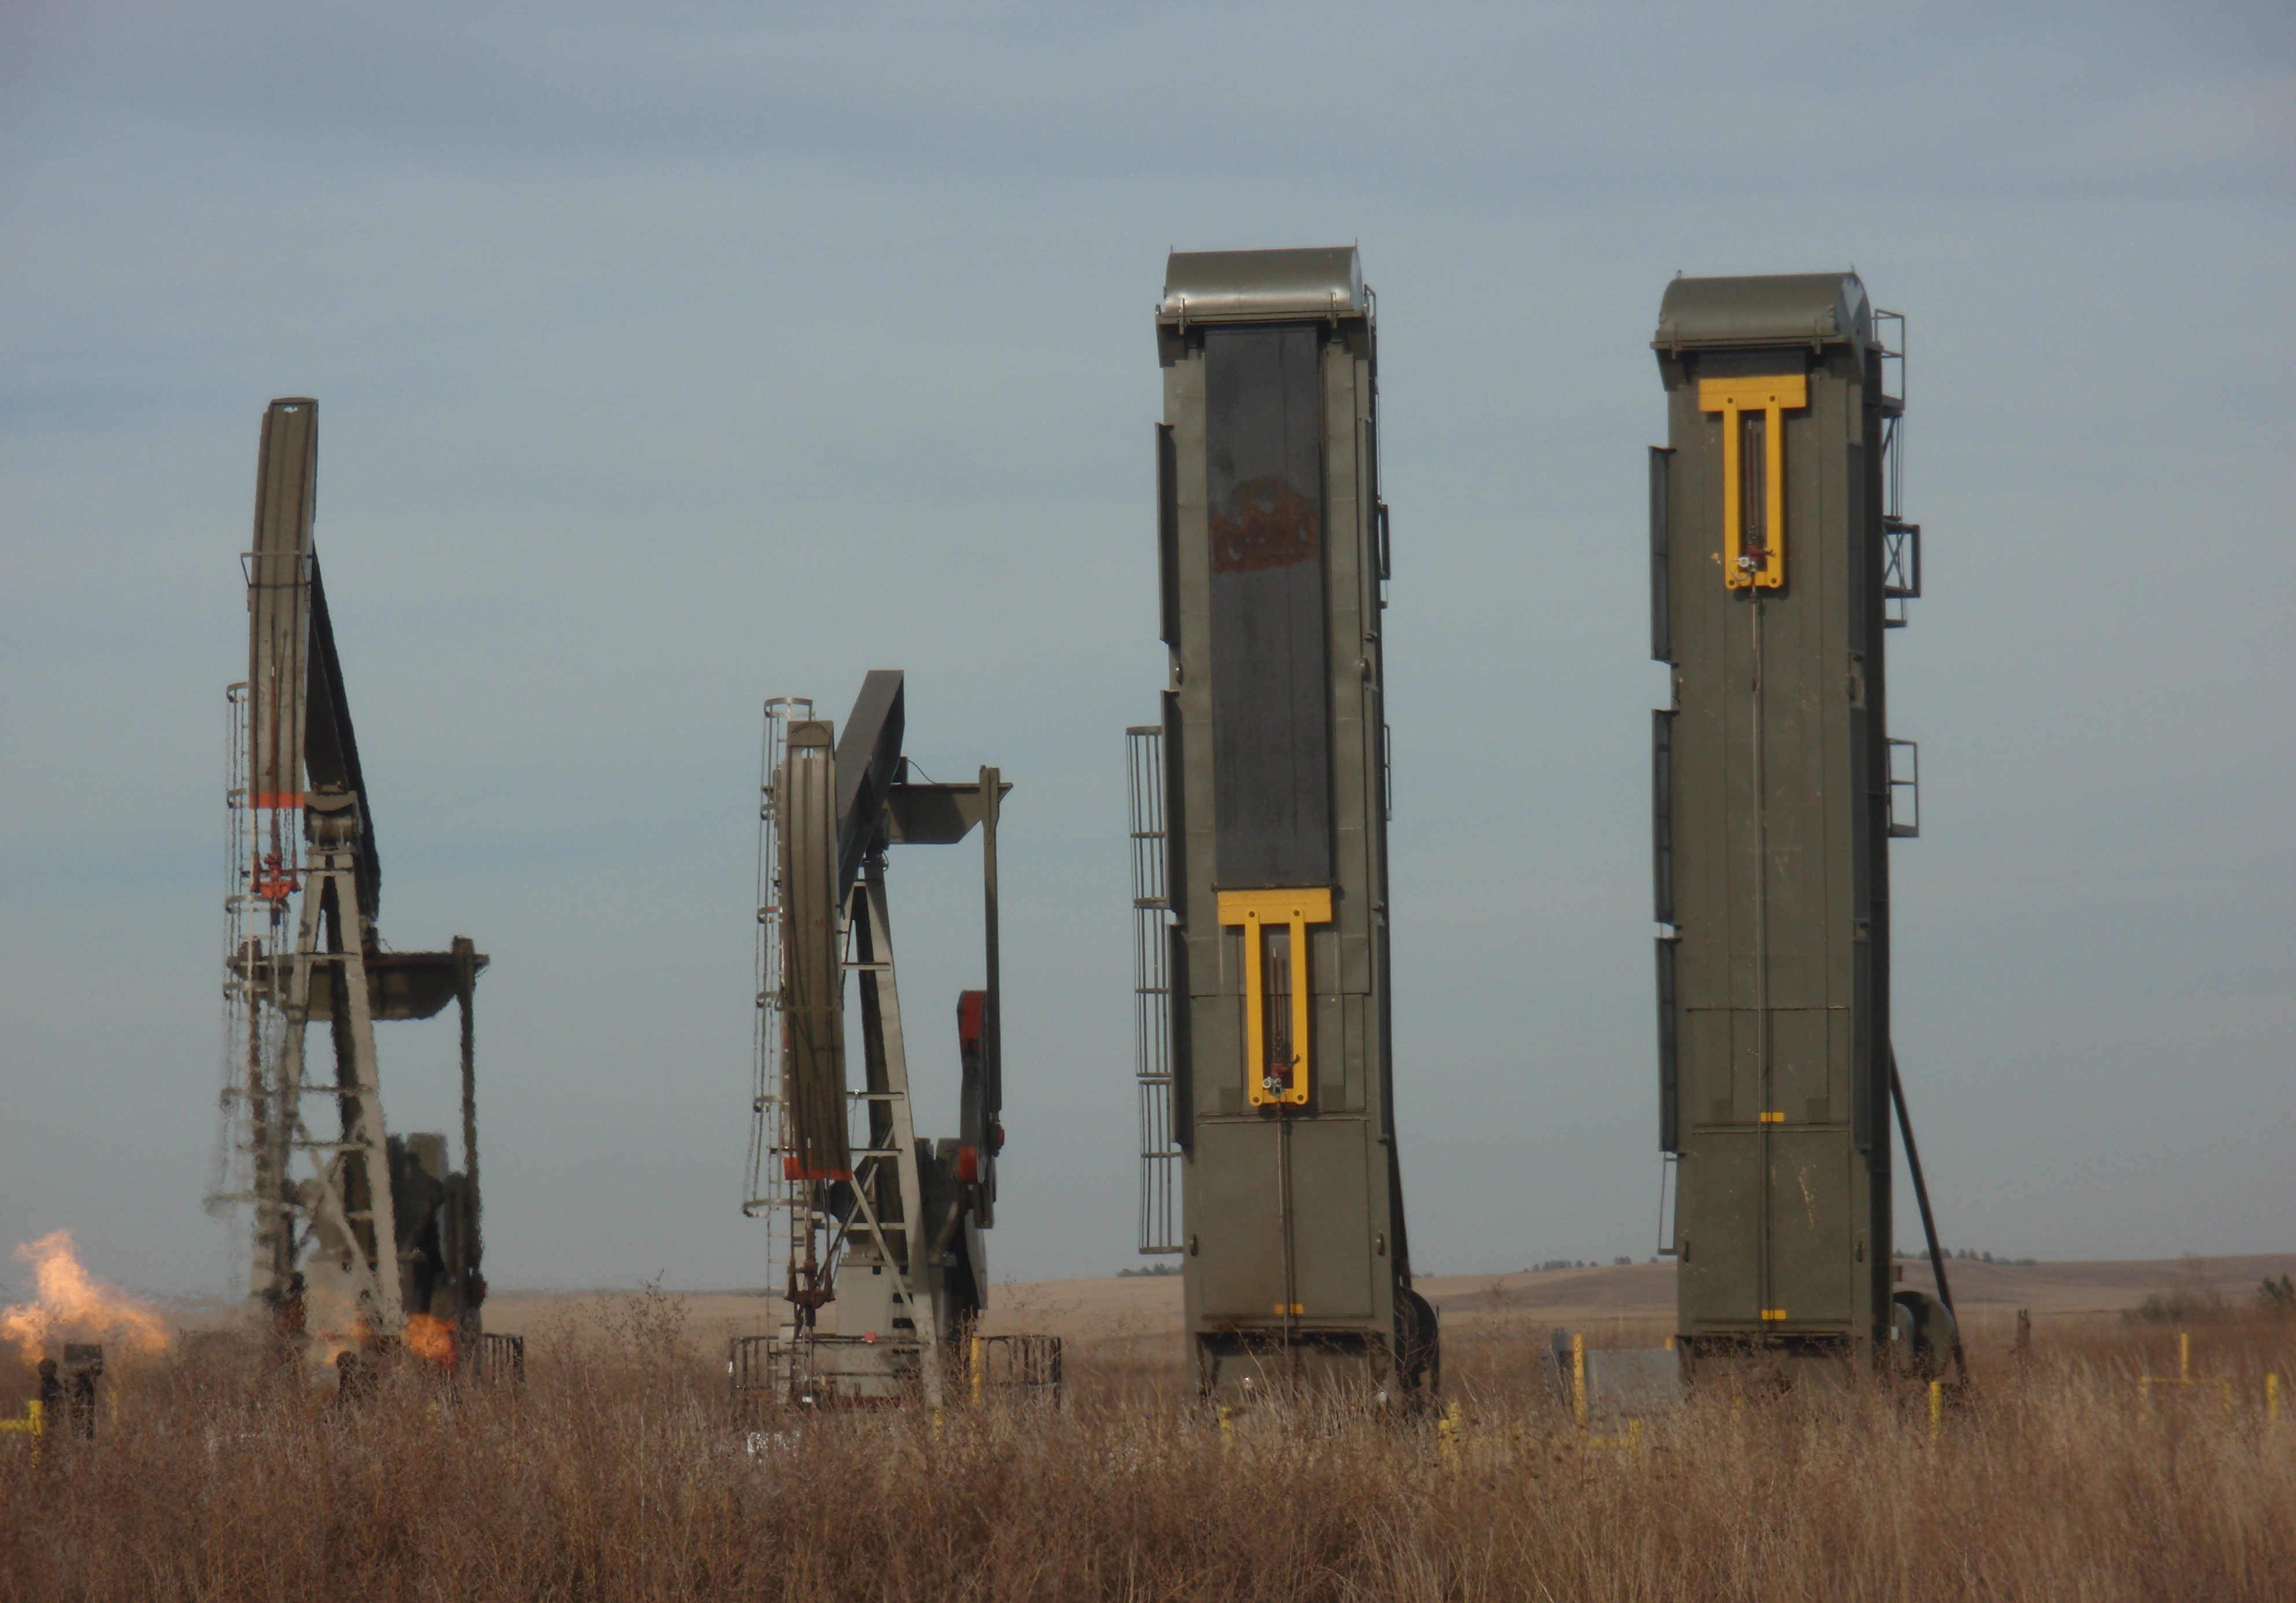
Four pumps pulling up oil that was untouchable 20 years ago. Photos by James Ulvog.

Prof. Mark Perry did a heap of learnin’ on his trip to Williston in May. He wraps up comments at his post, Top ten things I learned on my summer trip to the Bakken oil fields, Part II

My comments on part I here.

If you are looking for a primer on the oil revolution or Bakken or fracking, check out his articles.

A few highlights from his 3,000+ word post and a few of my thoughts. Continue reading “More great things to learn about Bakken – part 2”

Details from June ’15 Director’s Cut

The monthly report from Lynn Helms of the Department of Mineral Resources has lots of info about oil production.

Things I find interesting are highlighted in the following graphs:

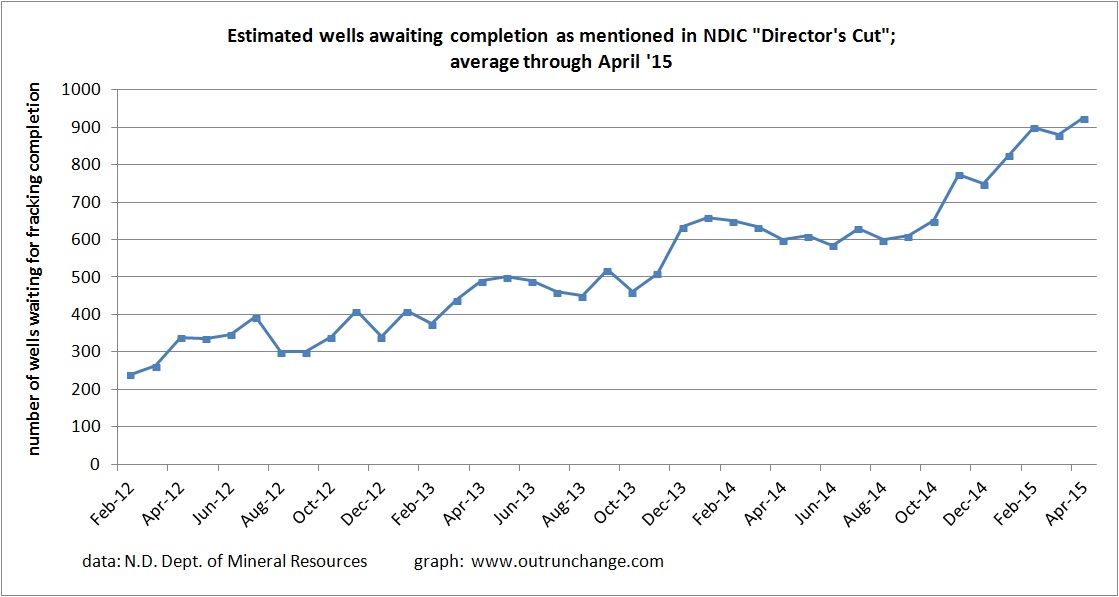
  • Fracklog increasing. This is the count of wells that have been completed but not fracked. Thus, no production. Bruce Oksol has characterized this as storing oil in the ground. Idea is to wait until prices recover, then bring the oil out of ‘storage.’
  • Oil prices are recovering. Quite a noticeable change.
  • Rig count continues to drop. Graph suggests a reduction in the rate of drop.

Here are the graphs.

Fracklog, or in-ground storage:

fracklog 6-15

Recovery in average price: Continue reading “Details from June ’15 Director’s Cut”

OPEC continues price war against shale

A June 6th Reuters article in the Dickinson Press says North Dakota refuses to flinch as OPEC keeps output highUnnamed company officials in North Dakota are calling OPEC’s decision to maintain a price war

… a questionable bet.

Article points yet again that drillers are dramatically reducing their costs. One executive said:

“High commodity prices hide a lot of inefficiencies in the system,”

Place your bets for or against ingenuity

The WSJ article below says OPEC members believe their strategy of high production (a.k.a. a price war) has been successful. Ooooookay.

As Prof. Mark Perry often says: Don’t bet against American ingenuity.

OPEC has doubled down on their bet.

Go for it.

Maintaining maximum production

Wall Street Journal reports OPEC Keeps Output Unchanged. At their meeting on June 5, OPEC kept their official production cap the same. Article points out this is now referred to by OPEC as “an indicator.”

Perhaps that is merely a recommendation, since producers are pumping as much oil as they possibly can with output understood to be about 1 million barrels a day above the suggested level.

Article says this confirms that OPEC, especially Saudi Arabia, is no longer the swing producer. That role, undesirable as it may be, has now shifted to American shale oil. It is slowly moving into common understanding that drilling in American shale is something that can be turned off and on rapidly.

The irony is the level of American shale production has not dropped off at the same time as OPEC has increased their production by roughly the amount that is produced in Bakken. That means the price war continues.

Continue reading “OPEC continues price war against shale”
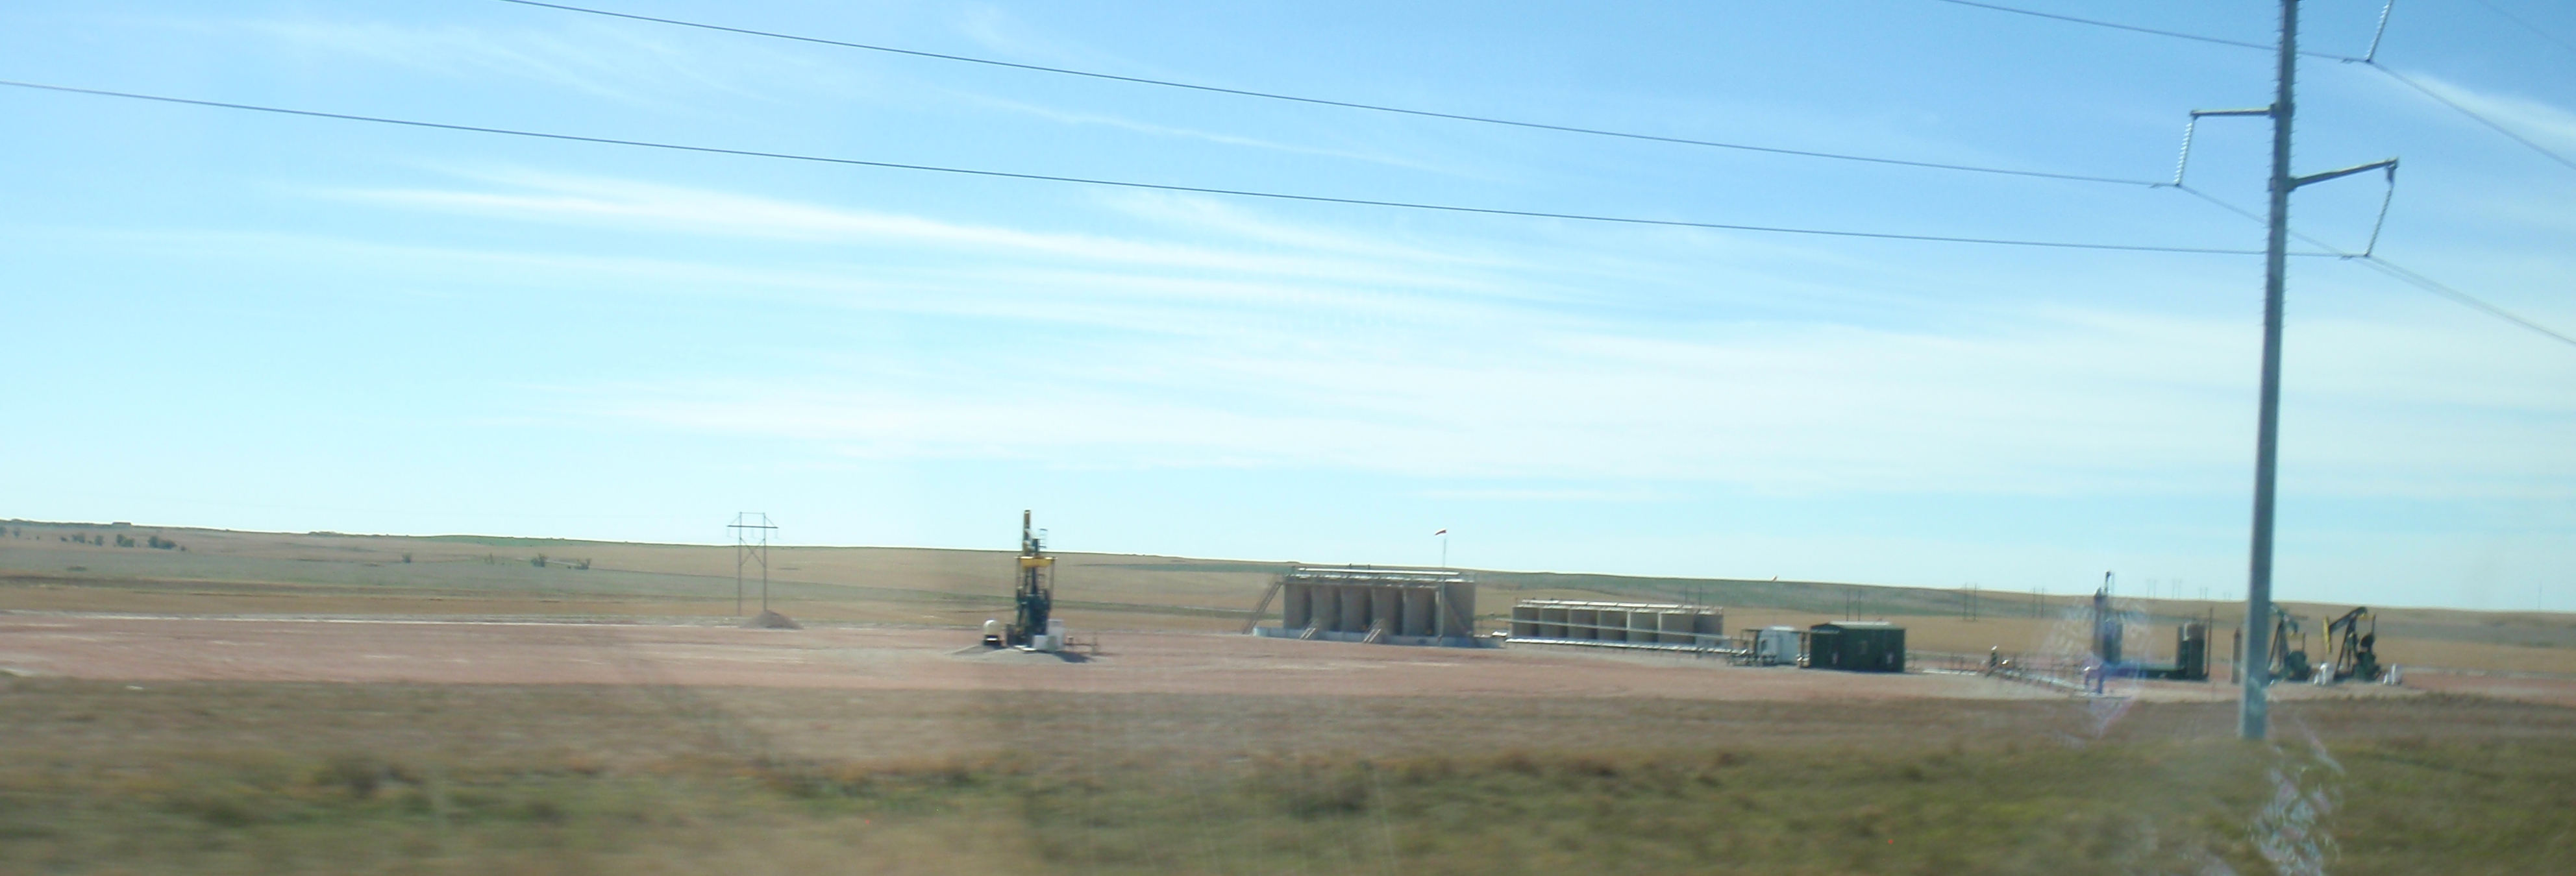
Oil exploration and production moves to manufacturing stage

The shale revolution is transitioning into a manufacturing stage where production can be turned on and off based on minor price fluctuations.

6/1 – Donald Luskin and Michael Warren at Wall Street Journal – The Shale Boom Shifts Into High Gear / Oil production is becoming a modern manufacturing process, with frackers using the ‘just-in-time’ approach

Think of it as Moore’s Law applied to oil production.

Combine two factors, increased efficiencies and rapid depletion. Continue reading “Oil exploration and production moves to manufacturing stage”