2 graphs of annual oil production in North Dakota through 2014

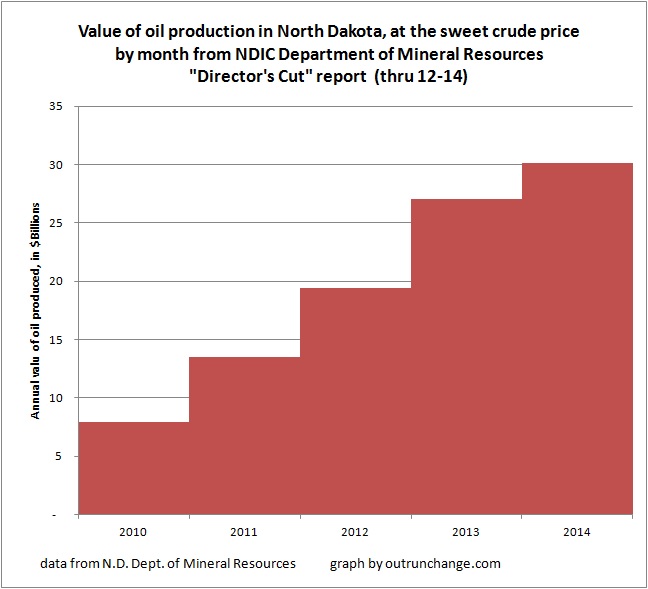
Here is are two pictures of the production of crude oil in the state. The monthly production is multiplied by the state’s calculation of average price with the monthly amounts aggregated.

Dollar value of production, in billions:

12-14 dollar productin by year

Amount of production, in millions of barrels:

Continue reading “2 graphs of annual oil production in North Dakota through 2014”

2 graphs showing dramatic change in production dynamics in N.D. – 2-15

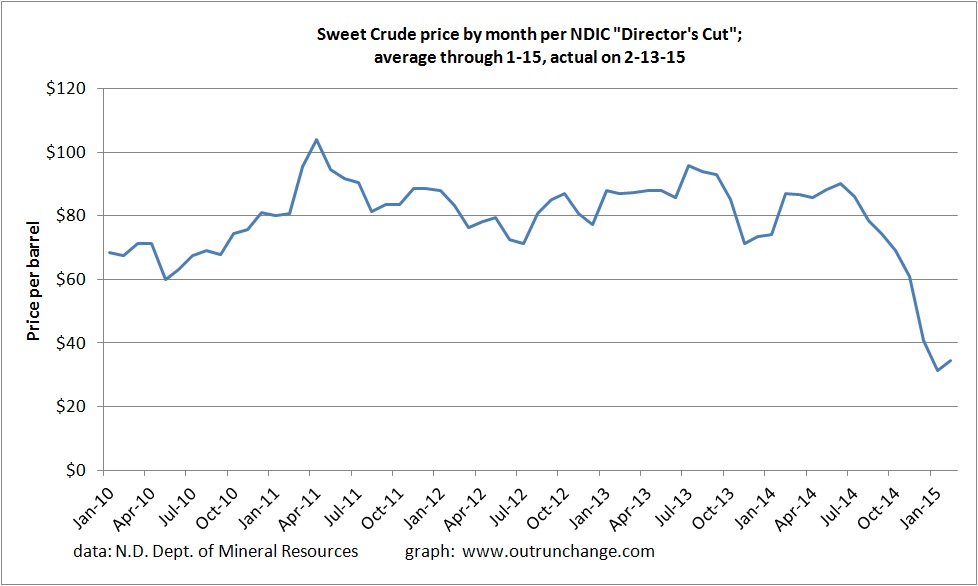
The price of crude oil realized in North Dakota is lower than the Gulf coast due to transportation costs. Here is a graph of the average price for the month as reported by the Department of Mineral Resources, Oil and Gas Division, of the North Dakota Industrial Commission. You can find the reports here.

12-14 price graph

Also, the number of rigs is dropping fast. Here is the average rig count, with an actual as of Friday’s report:

Continue reading “2 graphs showing dramatic change in production dynamics in N.D. – 2-15”

Oil production in N.D. hits record in December ‘14, breaking 1.2M bopd

Oil production averaged 1,227,344 in December, up from a slightly revised 1,188,258 in November, a 3.29% increase. Only passed the 1M bopd mark in April, eight months ago. Up 22% in eight months.

Rig count is dropping rapidly. Prices as well. More on that here.

Update before the graphs:  A few tidbits from the Department of mineral Resources director Lynn Helms on the information released Friday, as mentioned in the Bismarck Tribune’s article, Daily oil production passes 1.2 million barrels. He mentioned with oil prices starting to recover, there is a “renewed confidence” that the big trigger of oil tax reductions will not take place.

Article says, as I’ve mentioned previously, that the little trigger was pulled effective the first of February.

Flaring targets

Flaring dropped to 24% in December. He expects the January target to be met.

Targets for flaring, per the article:

  • 26% – 10/1/14
  • 23% – 1/1/15
  • 15% – two years
  • 10% – six years

Now to the graphs. Here is some statistical data to show the story better than my words can tell:
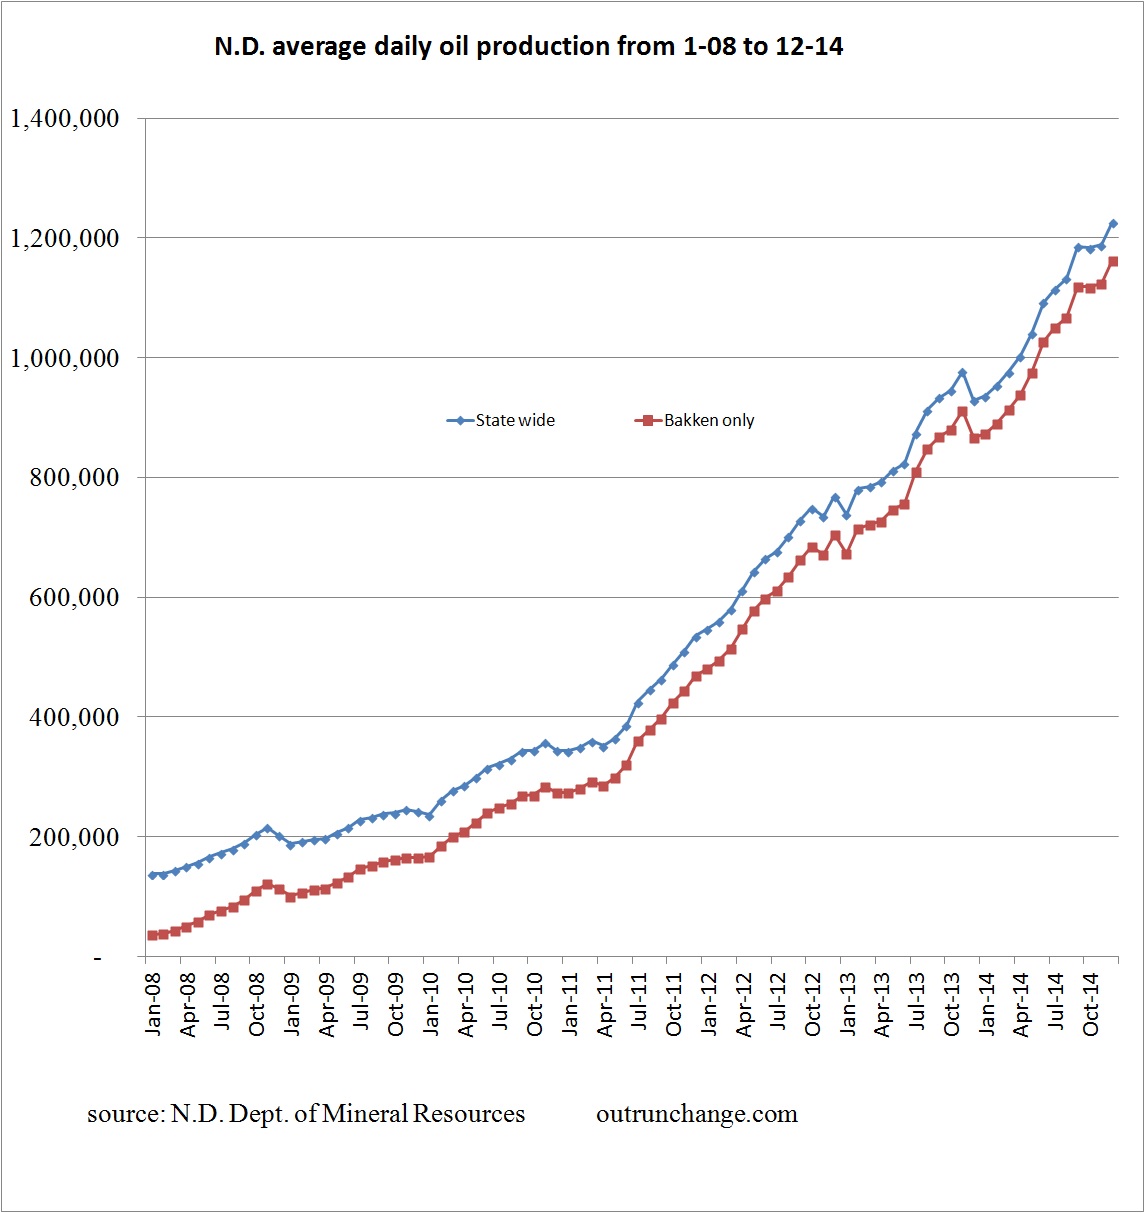
12-14 4 year production

For a longer term perspective:

Continue reading “Oil production in N.D. hits record in December ‘14, breaking 1.2M bopd”
More info on the triggers for drop in ND oil tax rate

There are two triggers for dropping the tax on oil in North Dakota. These were put in place back in 1987 to encourage production. With the dramatic drop in oil prices, these two triggers are now of interest.

2/5 – Reuters – Clock starts ticking on $5.3 bln tax break for North Dakota oilContinue reading “More info on the triggers for drop in ND oil tax rate”

About those dropping oil prices – #13

More articles on the drop in oil prices I found interesting.

Huge news Wednesday, 2/4, as oil collapsed big time dropping from about 53.50 to 48.50. Oh my, a $5 drop in just one day. Obviously gonna’ break the $40 mark this month, huh?

Oh wait.

Up 2.50 yesterday and another dollar as I write this morning.

Reminds me of the old joke on the days’ news about the stock market:  Stock market was off 500 points today before rallying and closing up 1 and a quarter.

1/24 – The Economist – The tough get going – Companies in the energy field are working to improve their economics.

Continue reading “About those dropping oil prices – #13”

Comments on North Dakota oil production. More info on big trigger and little trigger – 1/15/15

???????????????????????????????

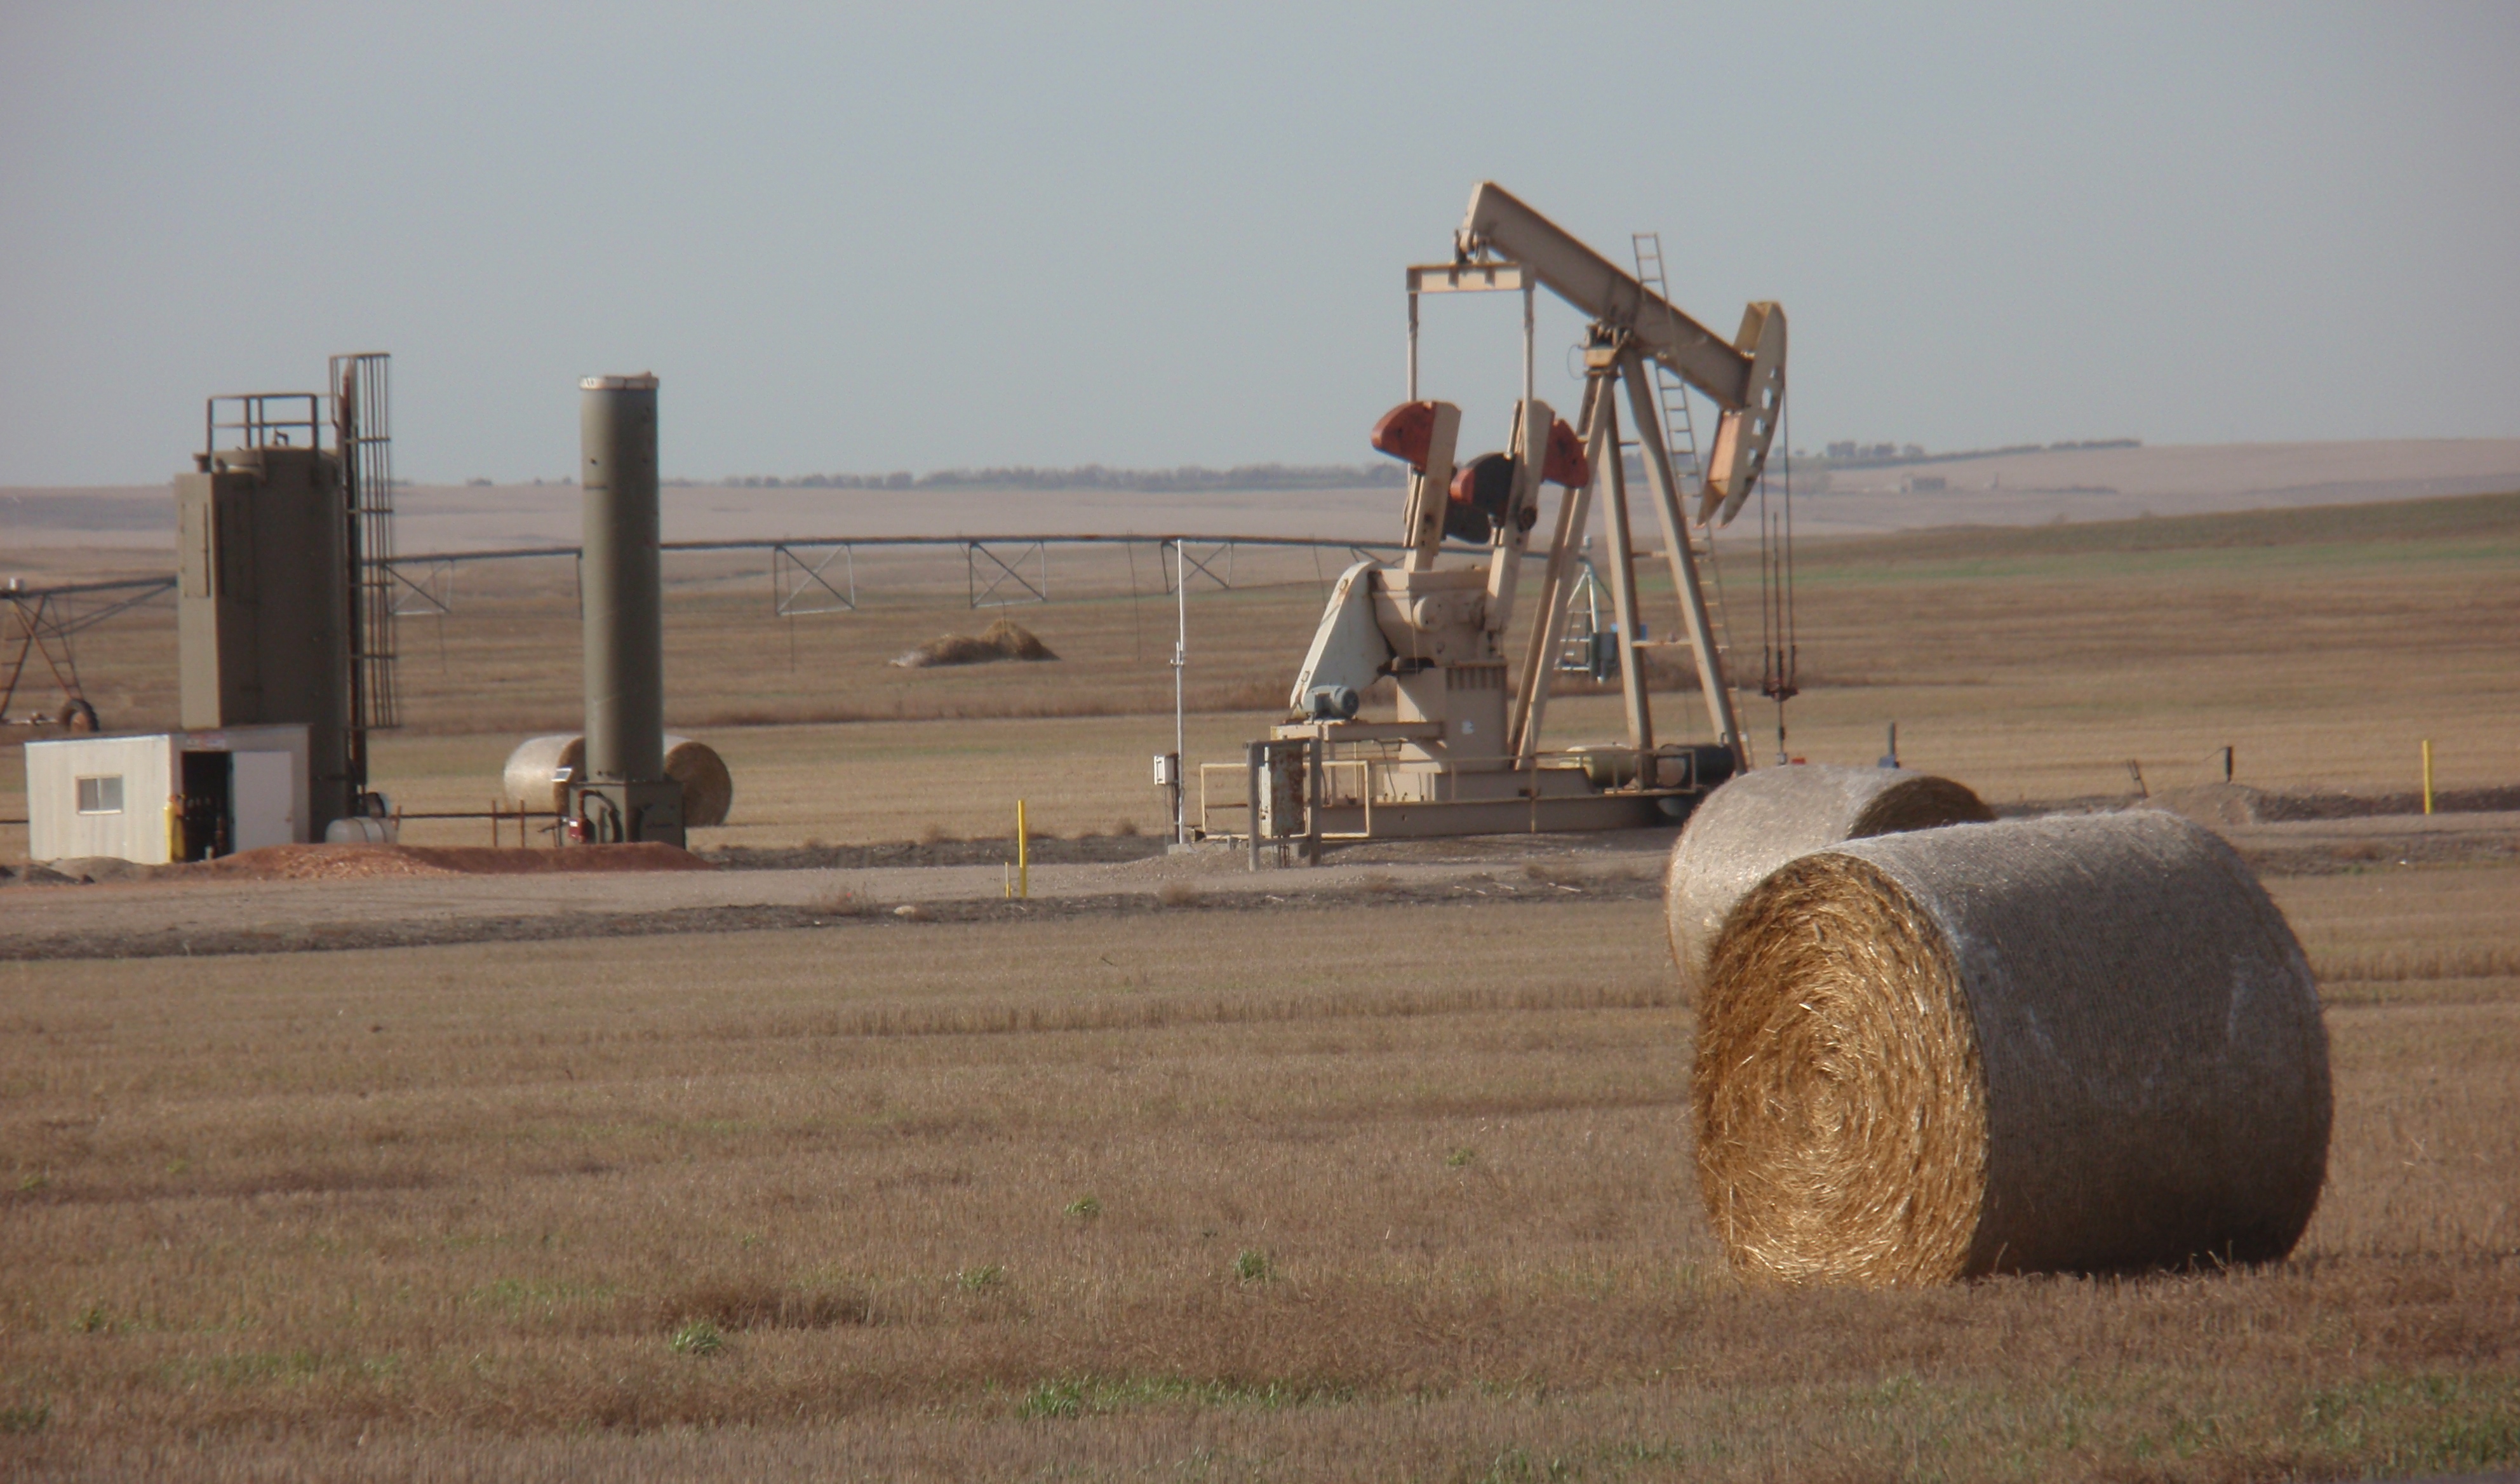
(Photo by James Ulvog. A view of what OPEC is trying to shut down. One drilling rig and one pump in foreground. One drilling rig in distant background. About half a dozen working pumpjacks are on the very short road to this site.)

The top oil regulator in North Dakota, Lynn Helms, spoke to media after releasing the monthly production data for November.

Multiple media sources covered the presentation. These comments from the Dickinson Press – Helms: Oil production could decline by third quarter.

He indicated drillers have pulled back to the four key counties of the Bakken region because the returns there are rich enough for drilling to remain profitable. Only 10 of current count of 158 rigs are outside those counties.

Info on rig count Continue reading “Comments on North Dakota oil production. More info on big trigger and little trigger – 1/15/15”

North Dakota oil production barely hits new record in November 2014

???????????????????????????????

(Photo by James Ulvog. Notice the miles and miles of farm land in the background with one or perhaps two wells in sight)

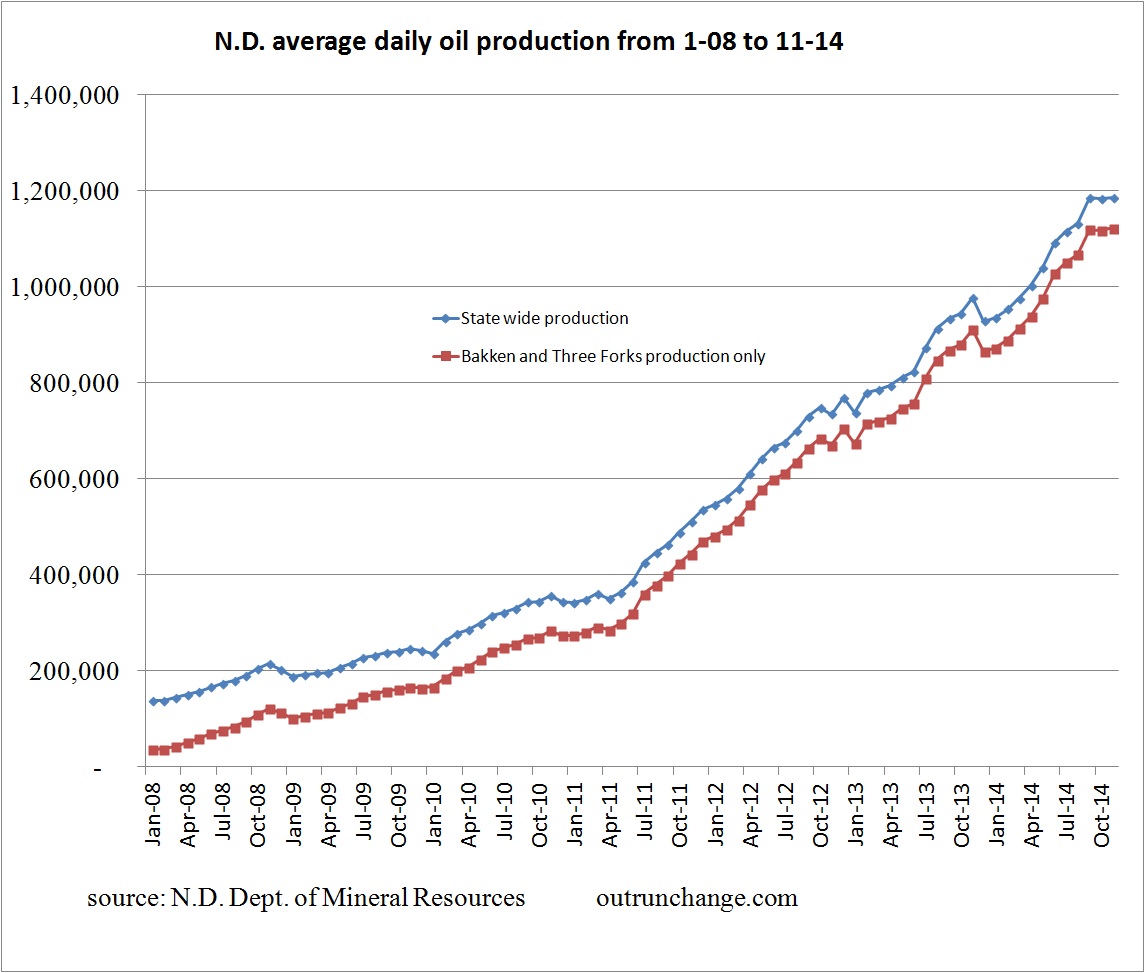
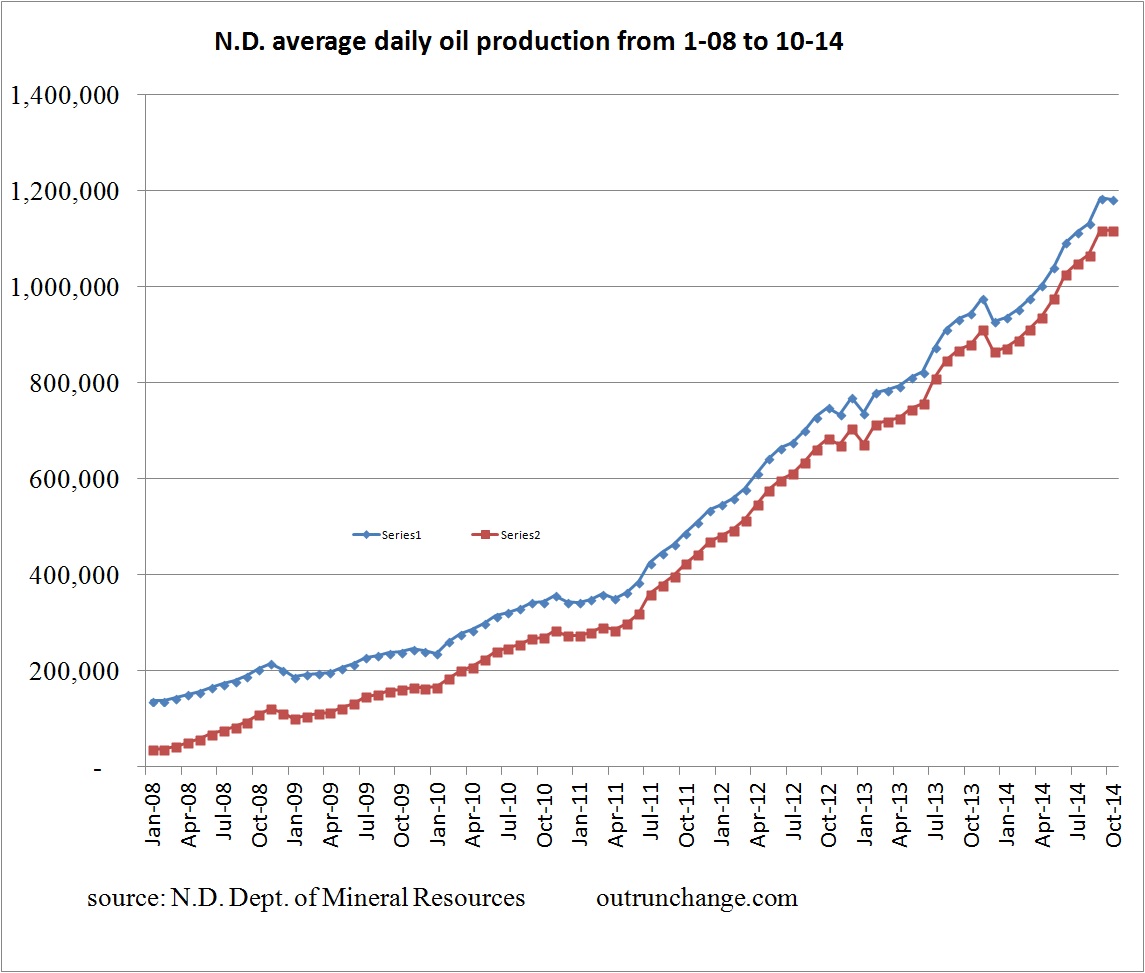
Crude oil production in North Dakota edged up a smidgen (0.31%) in November to an average 1,187,206 bopd from a revised 1,183,515 in October. The data for September and October was revised for one more well being reported. The October production was down a smidgen (-0.24%).

The November ’14 production is barely a record compared to the previous revised high in September ’14 of 1,186,305.

Here is my graph of production by month:

 nd production since 08

(Will someone please, please, claim that flat top is proof positive that Peak Oil doctrine is true? And that production will now start an irreversible decline to near zero? Please?)

Here is what the price trend looks like.

Continue reading “North Dakota oil production barely hits new record in November 2014”

About those dropping oil prices – #9 – on the price war


I have a backlog of articles about what’s going on with crude oil prices. Will start catching up.

Articles in this post look at the issue of whether this is a price war kicked off by Saudi Arabia.

1/8 – Reuters at Bakken.Com – No chance of OPEC output cut, even after oil dips below $50 – Gulf delegatesContinue reading “About those dropping oil prices – #9 – on the price war”

Best 2014 energy graphs from Carpe Diem

???????????????????????????????

(Photo by James Ulvog)

Carpe Diem has been running a recap of the best-of graphs from 2014. Last week the focus was energy:  My Top Ten Energy Charts of the Year For 2014.

Here are some of my favorites.  All graphs used with permission of Carpe Diem.

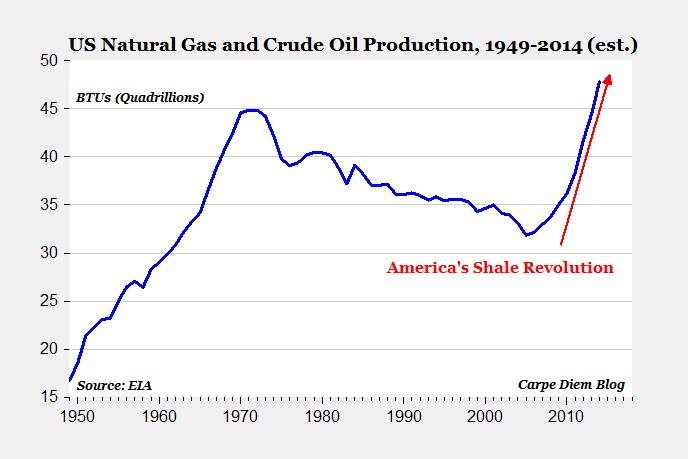
If you have just tuned into the energy revolution, look at these graphs to see how much things have changed in the last decade.

Check out the total U.S. production of crude oil and natural gas. That is a great proxy for the shale revolution.

energy gas and crude

Look at the crude oil only production graph. Continue reading “Best 2014 energy graphs from Carpe Diem”

Historical count of drilling rigs in North Dakota

With rig count dropping in the state, thought I’d look at the history of how many rigs are in operation. Here are two graphs to give some historical background. Data is from the website of the North Dakota Industrial Commission, Department of Mineral Resources, Oil and Gas Division. The general statistics page is here. Go to the monthly statistics line for the annual reports.

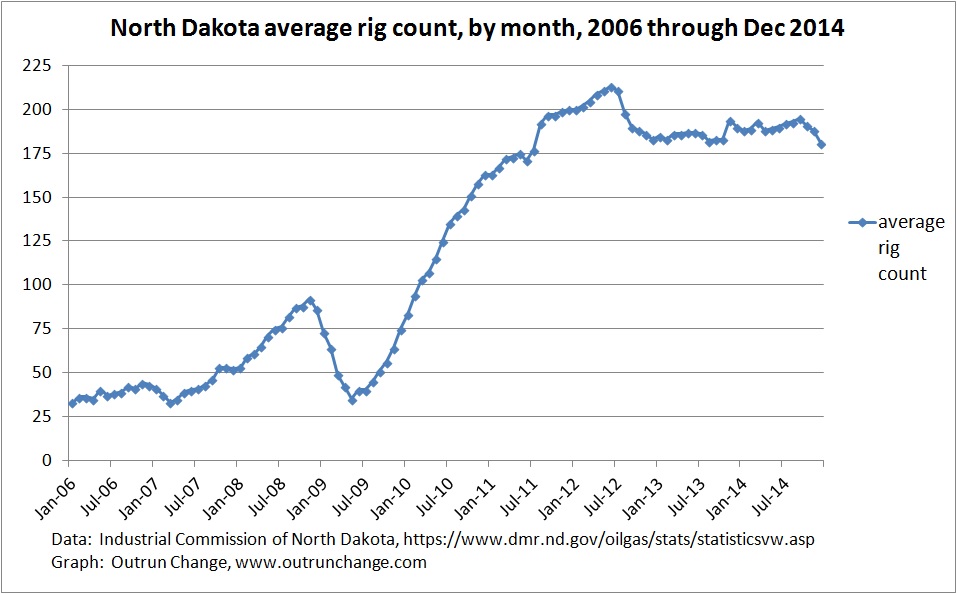
Here is the average count of rigs by month:

rig count by month 12-14

The impact of the Great Recession hit the rig count in late 2008 and early 2009. I think the drop in rigs in 2012 is due to rapid increases in productivity. Multipad drilling using walking rigs meant one rig could drill lots more wells.

Drop in count is quite visible in the last four months.

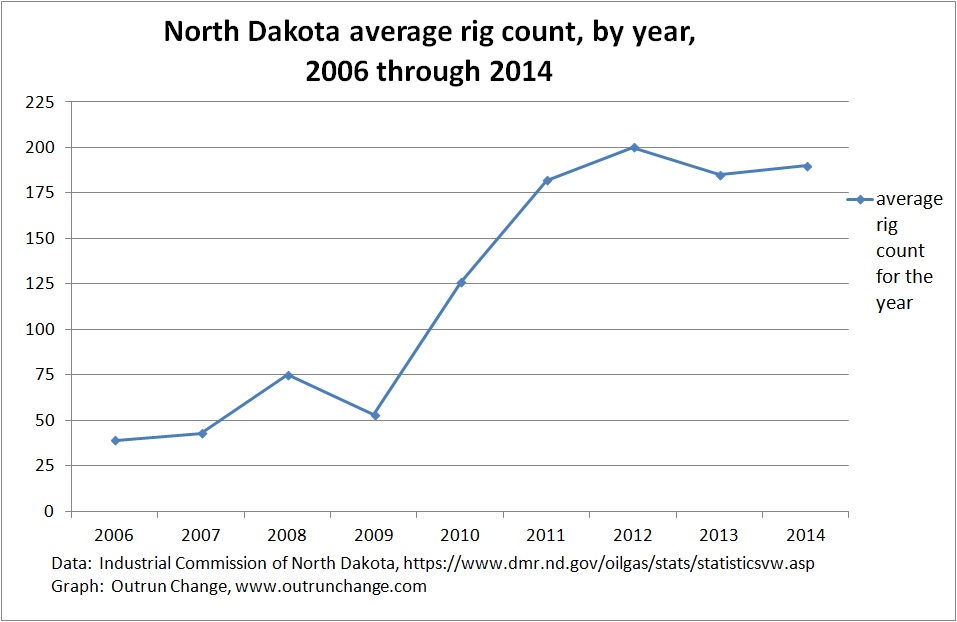
Here is the average count for each year:

rig count by year 2014

Drop in ’09 is quite visible.

My graphing ability is improving rapidly, having been watching Carpe Diem for a few years and learning a lot from Prof. Mark Perry by watching closely. Only took a few minutes to develop the above graphs.

About those dropping oil prices #7 – two must-read articles

Here are two major, must-read articles on oil production and pricing for your consideration. One I’ve been holding a while and the other ran just this week.

First a few quick tidbits to keep in mind – 12/23 – Dickinson Press – Oil prices will affect fringe areas most: Break-even mark lower in heart of Bakken – Drilling at the margins of Bakken will be sharply reduced. In the four core counties, not so much.

For active wells, a price of $15 a barrel is sufficient to keep operating. Ponder that – $15 a barrel.

Keep that in the back of your mind as you read of Saudi officials who want to see current production in Bakken and Eagle Ford drop far enough to balance supply and demand of world oil.

The first big article:

12-22 – Wall Street Journal – Behind OPEC Decision, A Saudi Fear of U.S. Shale

Saudi Arabia’s surprise move to maintain production and let oil prices collapse

… is a story of a budding rivalry, driven by what Saudi Arabia views as a threat posed by American energy firm …

according to the deeply reported article.

Continue reading “About those dropping oil prices #7 – two must-read articles”

About those dropping oil prices – 6

Have a lot of articles to discuss about what’s going on in the energy area. Lots of turmoil and uncertainty at the moment. Here are a few articles, to help get caught up:

12/6 – Economist – Sheikh v Shale – Love the cover illustration! I’ll be rooting for the shale guy in the showdown.

Article gives credit to shale oil for the drop in gas prices and oil prices. Take a bow, all you frackers in Bakken, Eagle Ford, and Permian! A $40 drop in price moves $1.3 trillion a year from producers to consumers. That is a savings of around $800 a year for an average American, or equivalent to a 2% pay raise, according to the article

Continue reading “About those dropping oil prices – 6”

More info from 12/14 Director’s Cut – Indicators for near term

For follow-up to my previous post on October oil production data in North Dakota, check out the Dickinson Press’ discussion of comments from Mr. Lynn Helms:  Prices could plateau production: Hems says 2015 could be tough for oil.

Here are a few tidbits that help me understand what is going on around us:

Mr. Helms, who is director of the ND Department of Mineral Resources, didn’t think oil prices would drop this far.

Article says that on Friday sweet crude prices were $41.75 a barrel in North Dakota and $57.81 on the New York Mercantile.

Graphic at the Bakken Magazine says on Friday the Brent price was $62.05 and Cushing was $57.99. I’m slowly catching on (but you already knew that), so that graphic tells me that the Cushing price is also called the West Texas Intermediate index.

Rig count

Continue reading “More info from 12/14 Director’s Cut – Indicators for near term”

North Dakota oil production in October ’14 plateaus, likely for the winter

Total production in October 2014 averaged 1,182,174 bopd. That is down a smidgeon (2,461 bopd) from the preliminary of 1,184,635 in September, and down a smidgeon more (4,054 bopd) compared to the slightly revised 1,186,228 amount for September.

Here is what the total and Bakken-only production looks like:

ND production 10-14 total


The Director’s Cut each month has narrative on the month along with  more statistical data. The December report is here.

Price of sweet crude

Continue reading “North Dakota oil production in October ’14 plateaus, likely for the winter”

A discussion about finite oil

A commenter on my blog has asked a few questions. We have a pleasant discussion running.

Yesterday he asked if the amount of oil is finite.

As I started to reply, I just kept writing and writing. Decided to move my comment to a separate post so the conversation is more visible.

On December 9, Stig Helmer (self-identification) said: Continue reading “A discussion about finite oil”